

Software Growth: software code quality metrics for robust apps
Software code quality metrics are simply objective ways to measure the health, stability, and future-proofness of your codebase. They take fuzzy concepts like "good code" and turn them into hard data. This data helps your team get a handle on technical debt, squash bugs before they happen, and ship new features with confidence.
Think of them as the vital signs for your software project.
Why Software Code Quality Metrics Matter
Trying to build software without metrics is like flying a plane without any instruments. Sure, you feel like you're moving forward, but you have no real idea of your altitude, your speed, or whether you're about to fly straight into a mountain. Code quality metrics give you the dashboard you need to navigate the tricky parts of development, replacing pure guesswork with smart, informed decisions.
Without these numbers, teams are stuck relying on feelings. A developer might say a feature "feels complicated," but what do you do with that? It's not actionable. Metrics swap that ambiguity for clarity. For instance, knowing a specific module has a high Cyclomatic Complexity score gives the team a clear, concrete target for refactoring.
The Business Impact of Tracking Code Quality
Let's be clear: ignoring code quality isn't just a technical problem. It's a business problem that silently racks up costs over time. Poor quality code leads directly to what we call technical debt—the hidden cost of rework you'll have to pay later because you chose the easy solution now instead of the right one.
This debt shows up in a few painful ways:
- Slower Feature Delivery: Your team ends up spending most of its time fixing bugs and untangling spaghetti code, which leaves very little room for innovation.
- Increased Bug Rates: Code that's unstable and hard to read is a breeding ground for defects. This leads to a frustrating user experience and can directly hit your bottom line.
- Higher Maintenance Costs: A messy codebase just takes more developer hours to understand, change, and debug. Those hours add up, driving your long-term operational costs through the roof.
- Developer Frustration: Nobody enjoys wrestling with a difficult codebase. It leads to burnout and high turnover, which is a massive expense for any company.
By keeping an eye on a few key software code quality metrics, teams can get ahead of these risks. They can spot "hotspots" in the code that are likely to cause trouble, use objective data to make code reviews faster and more effective, and build a real business case for why that refactoring project is so critical. As new tech emerges, it's also smart to consider its effects on things like the quality of AI-generated code to keep your standards high.
Code quality isn’t about chasing perfect scores. It’s about building a sustainable development process where quality is a shared responsibility, helping teams build better products faster and with way more confidence.
Tools like static analyzers are a huge help in automating this whole process. If you want to see how they work under the hood, check out our deep dive on the Sonar static code analyzer, one of the most popular tools out there. At the end of the day, these metrics give you the visibility you need to build software that’s resilient, scalable, and doesn't cost a fortune to maintain.
The Four Pillars of Code Maintainability
We’ve all heard horror stories about codebases so brittle that every new feature request sends a wave of fear through the engineering team. This is the price of unmaintainable code. It's not just a minor inconvenience; it's the anchor that drags down developer velocity and sinks product stability.
Think of maintainability as a table with four legs. If one leg is weak, the whole structure wobbles. If two are weak, it’s useless. Tracking the right software code quality metrics is how you turn this abstract idea into something you can actually measure and manage.
By keeping an eye on these four pillars, your team gets a clear, objective picture of your codebase’s health, making it easier to build software that can actually evolve with your business.
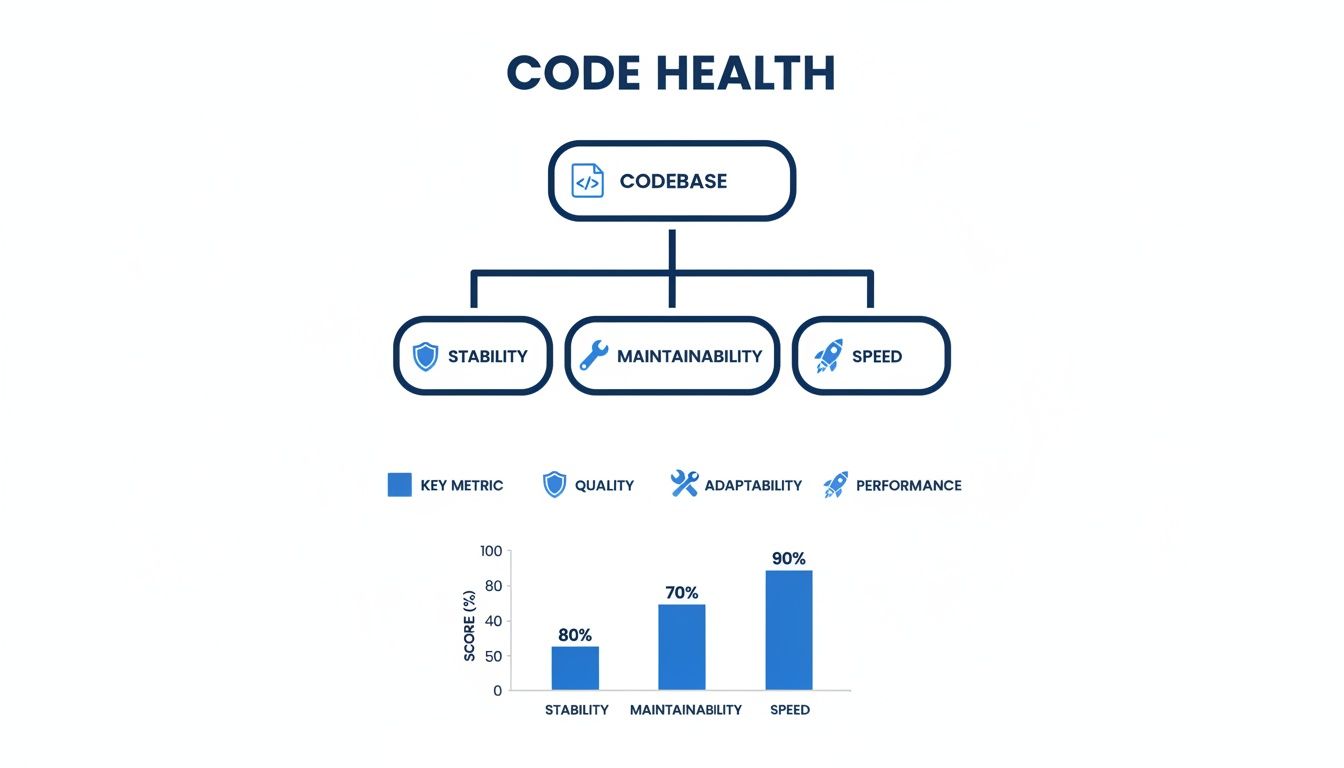
As the diagram shows, maintainability isn't just a siloed concern—it's a core component of overall code health that directly impacts your ability to ship stable, fast software. Let's dig into the specific metrics that bring it to life.
Pillar 1: Cyclomatic Complexity
Ever tried to untangle a massive knot of yarn? That frustrating experience is exactly what it feels like to work with complex code. Cyclomatic Complexity is the metric that quantifies this tangled mess.
It boils down to the number of unique paths through a function or method. A simple function with one if-else statement has two paths. But start nesting more loops and conditionals, and that number balloons surprisingly quickly.
High complexity is a massive red flag for a few reasons:
- It’s hard to reason about. Developers have to juggle more logic in their heads just to figure out what the code is supposed to do.
- It’s a nightmare to test. Covering every possible branch becomes exponentially harder, which means hidden bugs are almost guaranteed.
- It’s prone to breaking. A small change in one part of a complex function can have totally unpredictable ripple effects.
This metric has been around since 1976, but it’s as relevant as ever. Research shows that while a score under 8 is ideal for functions, a shocking 40% of enterprise code blows past a complexity score of 15. It’s no coincidence that top-performing DORA teams cap their module complexity at 15, a standard that helps them maintain 99.9% uptime. For a deeper dive, you can read the full research about these code quality benchmarks.
Pillar 2: Code Duplication
Imagine you have a dozen different copies of the same important document floating around. When you need to update a critical piece of information, you have to hunt down and change every single copy. Miss one, and you’ve just created a landmine of inconsistency. That’s code duplication.
This metric, usually shown as a percentage, tells you how much of your codebase is just copy-pasted blocks of code. A little bit might be unavoidable, but a high duplication rate is a clear sign of trouble brewing.
Duplicated code doesn't just double your workload—it multiplies your bug risk. A single flaw in a copied block of code instantly becomes a widespread problem that's a pain to track down and fix completely.
We’ve all seen it happen: a developer fixes a bug in one place but misses the other five duplicated instances. Boom, instant regression. Tools like SonarQube are great for sniffing this out and helping teams stick to the "Don't Repeat Yourself" (DRY) principle.
Pillar 3: Code Coverage
Code coverage asks a simple but vital question: how much of our code is actually being tested by our automated test suite? It's the percentage of your code—lines, branches, or functions—that gets executed during a test run.
Think of it as a quality check on your safety net. A 0% coverage score means you’re basically free-climbing without a rope. A high score, usually above 80%, gives you confidence that your tests are at least running through the logic you’ve written.
But here’s the catch: coverage isn't everything. It’s entirely possible to have 100% coverage with tests that don't actually check for the right outcomes. The goal isn’t just to run the code, but to assert that it does what you expect it to do under different scenarios.
Pillar 4: Defect Density
If you want the bottom line on quality, look no further. Defect Density measures the number of confirmed bugs found in a piece of code, usually normalized per thousand lines of code (KLOC). This gives you a standardized way to compare the quality of different parts of your application.
A module with high defect density is what we call a "hotspot." It’s an area that is likely unstable, poorly designed, or just isn't tested well enough. Tracking this metric helps teams:
- Prioritize refactoring: Focus your cleanup efforts on the buggiest, most painful parts of the codebase first.
- Improve QA focus: Allocate more testing resources to high-risk areas before they cause chaos in production.
- Gauge process health: If defect density is creeping up everywhere, it might be a signal that something is broken in your development or review process.
Here's a quick summary of how these four metrics work together to define code maintainability.
Key Maintainability Metrics at a Glance
| Metric | What It Measures | Ideal Threshold | High-Risk Indicator |
|---|---|---|---|
| Cyclomatic Complexity | The number of independent paths through a function; a measure of "tangledness." | Below 8 | Over 15; difficult to test and understand. |
| Code Duplication | The percentage of code that consists of repeated blocks. | Below 5% | Over 10%; multiplies maintenance effort and bug risk. |
| Code Coverage | The percentage of code executed by the automated test suite. | Above 80% | Below 60%; indicates a weak safety net. |
| Defect Density | The number of confirmed bugs per thousand lines of code (KLOC). | Below 1.0 | Above 2.0; signals unstable or poorly designed code. |
Together, these pillars provide a powerful framework for turning "good code" from a vague opinion into a measurable goal. Ignoring them is a recipe for technical debt and developer burnout. Actively managing them is how you build software that’s a pleasure to work on—not a pain to maintain.
How Code Movement Reveals Hidden Risks
Static metrics like complexity and duplication are great for giving us a snapshot of the code's health at one specific moment. Think of it like a photograph of a car engine—you can see if a part looks rusty or if a wire is disconnected.
But to really know if that engine is reliable, you have to turn the key and see how it runs. That’s where dynamic metrics come in. They track how your code moves and changes over time, revealing the kinds of hidden risks a static photo could never capture.
These metrics are your early warning system. They don't just measure the code's structure; they measure the behavior of the development process itself. By watching for certain patterns in how code gets modified, you can predict exactly where instability and bugs are going to pop up next.

Uncovering Hotspots with Code Churn
Picture a single street in your city that’s constantly under construction. One week they’re replacing the water pipes. The next, it’s the electrical lines. The week after that, they’re repaving the whole thing. You'd rightly assume there's a deep, fundamental problem with that street's infrastructure.
This is exactly what Code Churn shows you in your codebase.
Code churn measures how often code is added, modified, or deleted within a file or module over time. When a file has high churn, it means developers are constantly in there, often rewriting the same logic again and again. This isn't just a sign of "active development"—it's a massive red flag pointing to deeper issues.
High churn almost always signals one of these problems:
- Unclear Requirements: The team doesn’t have a clear vision for a feature, so the code is in a constant state of flux as they chase a moving target.
- Design Flaws: A module with a bad architecture requires frequent, painful changes just to accommodate new, simple functionality.
- Brittle Code: The code is so tightly coupled that a small change in one spot causes a cascade of breakages elsewhere, leading to an endless cycle of fixes.
Code churn is your crystal ball for predicting bugs. Files with the highest churn are almost always the ones that will generate the most defects in the future, making them prime candidates for focused testing and refactoring.
A recent analysis of over 10,000 repositories confirmed this, finding that high churn rates (above 20%) correlate with 2-3x higher defect rates. This research shows how churn can reveal mounting technical debt long before it causes a major outage. You can discover more insights about software quality metrics and see how top teams are managing this exact risk.
Commit Frequency and Team Workflow
While churn looks at what is changing, Commit Frequency tells you how it's changing. This metric tracks how often developers commit their work, and it offers a surprisingly clear window into your team's workflow and collaboration habits.
Think about building a brick wall. You could try to lift and place half the wall at once—a huge, risky move where one tiny mistake could bring the whole thing crashing down. Or, you could lay one brick at a time, making sure each one is perfectly set before moving on. The second approach is slower at first, but it's far more stable and predictable.
That’s the difference between large, infrequent commits and small, frequent ones.
- Large, Infrequent Commits: These "big bang" changes are a nightmare to review, a pain to debug, and almost always lead to agonizing merge conflicts.
- Small, Frequent Commits: This is the heart of Continuous Integration. It makes changes easy to understand, review, and test, ensuring the codebase stays in a stable, working state.
By monitoring commit frequency, engineering leads can spot when developers might be working in isolation for too long, which dramatically increases the risk of integration problems. A healthy, steady commit pattern is a strong indicator of a collaborative and agile team that values stability and shared ownership. It’s one of the most effective, yet simple, software code quality metrics for gauging the health of your process.
Bringing Quality into Your Daily Workflow
Measuring software code quality metrics is one thing; actually doing something about them is another entirely. The best quality programs don’t just happen at the end of the line with a final inspection. Instead, they weave quality checks right into the fabric of the daily development process—a practice people often call "shifting left."
This approach flips the script on quality, turning it from a late-stage gatekeeping chore into a real-time, shared responsibility. By embedding automated analysis directly where developers live and breathe code, you create a powerful and immediate feedback loop. Every single commit becomes an opportunity to learn and get better, catching potential issues in minutes instead of weeks.

The goal here is simple: make doing the right thing the easiest thing to do. When feedback is instant, developers can fix problems while the context is still fresh in their minds. No more costly context-switching to revisit code they wrote days ago.
Integrating Quality into the IDE
The absolute earliest you can catch a quality issue is the moment the code is written. This is why plugging static analysis tools directly into the Integrated Development Environment (IDE) is the first real step toward building a proactive quality culture.
Imagine a developer writing a function that’s starting to get a little too complicated. An in-IDE tool can flag it right away, underlining the problematic code just like a spell checker catches a typo. That immediate nudge helps developers self-correct on the spot.
Platforms like kluster.ai take this even further by providing real-time AI code review. As AI assistants generate code, kluster.ai’s specialized agents analyze it in seconds. They're checking for everything from logic errors and security vulnerabilities to whether it follows your team's specific coding standards. This moves the review process from a pull request bottleneck to an instant, in-editor verification.
Automating Checks in the CI/CD Pipeline
The next critical checkpoint is your Continuous Integration/Continuous Deployment (CI/CD) pipeline. This is where you draw your lines in the sand—your non-negotiable quality gates. Automating these checks ensures that no code failing to meet your standards can ever be merged into the main branch. Period.
This process usually breaks down into a few key steps:
- Trigger on Commit: Every time a developer pushes code to a branch, the CI server (like Jenkins or GitHub Actions) automatically kicks off a build.
- Run Static Analysis: As part of that build, automated tools scan the new code against your predefined rules, checking metrics like cyclomatic complexity, code duplication, and security holes.
- Enforce Quality Gates: The build is set up to fail if the code violates any critical thresholds. For example, if code coverage dips below 80% or a high-severity security flaw gets introduced, the build stops in its tracks.
By making quality gates a mandatory part of the pipeline, you turn your standards into automated, unbreakable rules. This removes the subjective back-and-forth from code reviews and gives developers clear, objective feedback on every single commit.
This automated enforcement frees up your human reviewers to focus on what they do best: thinking about the bigger picture, like architectural design, business logic, and the overall strategy of the code. Code reviews become faster and more meaningful because all the mundane, automatable checks are already handled.
Adding a structured quality assurance check into this daily workflow helps lock in consistency across the team. This kind of repeatable process is absolutely essential for scaling your quality efforts and maintaining a healthy, resilient codebase for the long haul.
Turning Metrics into Meaningful Action
Collecting data on software code quality metrics is the easy part. The real challenge is turning those numbers into a smart, actionable game plan. It's shockingly easy to fall into the "metric fixation" trap—where teams just chase perfect scores without ever understanding the why behind the numbers.
This is a recipe for a culture of fear. Developers get punished for a high complexity score instead of being empowered to fix the root cause. A much healthier approach is to focus on trends over time. Metrics should be conversation starters, not weapons.
Your first move is to establish a baseline. You can't improve what you don't measure, so you need to know where you stand right now. Run your quality analysis tools across the entire codebase to get a complete snapshot. This is your starting point, the benchmark against which all future progress will be measured.
Setting Realistic and Actionable Goals
With a baseline in hand, you can start setting goals that actually drive change. Forget vague targets like "write better code." That helps no one. The key is to create specific, measurable objectives the whole team can get behind.
A great goal has a clear focus and a deadline. For example, instead of a blanket ban on all functions with a complexity score over 15, a much more powerful goal sounds like this:
"This quarter, our team will refactor the ten most complex files in the authentication service to reduce their average cyclomatic complexity by at least 20%."
This works so well because it's:
- Specific: It targets a known problem area (the top ten complex files).
- Measurable: The goal is a 20% reduction—easy to track, no ambiguity.
- Achievable: It focuses on a manageable chunk of work, not a soul-crushing rewrite.
- Relevant: It directly attacks a pain point that's probably slowing everyone down.
This simple shift turns an abstract number into a concrete project with a clear finish line. It’s also a much smarter way to manage technical debt. You can learn more about how to prioritize and reduce tech debt in our detailed guide. This kind of targeted effort delivers a much bigger bang for your buck than trying to fix everything all at once.
Using Metrics for Team Improvement
Metrics are most effective when they’re owned by the team, not just handed down from management. They should be talking points in your sprint retrospectives to build a culture of continuous improvement.
For instance, if you notice defect density is creeping up in a specific module, the conversation shouldn't be about who wrote the buggy code. Instead, the team should ask, "What is it about this part of the codebase that makes it so fragile? Are the requirements fuzzy? Is our test coverage too thin here?"
In software, defect density is a crucial quality signal, measuring defects per thousand lines of code (KLOC). Elite teams often keep their density below 1 per KLOC. In fact, data from Fortune 500 companies shows that tracking this metric helped them slash production issues by 25% year-over-year, which led to a 15% boost in customer retention.
This reframes the problem as a collective challenge the team can solve together. When teams use software code quality metrics to guide their discussions and prioritize work, they build a shared sense of ownership over the codebase. The goal isn't just to hit perfect scores—it's to build a healthier, more resilient system that lets your team ship features with confidence.
Your Top Questions, Answered
Even when teams understand what code quality metrics are, turning them into a daily practice brings up a lot of questions. It’s a big shift to start making decisions based on data, and it's natural to have some concerns. We've heard them all, so let's tackle the most common ones head-on.
The whole point of this is to give your team objective insights, not to wrap them up in red tape. Done right, metrics are tools that spark collaboration and help everyone build better, more stable software without killing momentum.
What’s the Single Most Important Code Quality Metric?
If you have to pick just one to get started, go with Cyclomatic Complexity. It gives you the most bang for your buck right away. This metric is a direct measure of how tangled and convoluted your code is, which is one of the biggest red flags for future bugs and maintenance nightmares.
By finding your most complex functions and refactoring them first, you're making a high-impact investment in your codebase's health. Simplifying just one gnarly module can prevent dozens of bugs down the road.
Of course, a single metric never tells the whole story. The real power comes when you combine it with other key indicators.
- Code Coverage: Are your most complex functions protected by a solid testing safety net?
- Defect Density: Is that complexity actually causing real-world bugs that customers are hitting?
Starting with complexity gives you a clear target, but adding coverage and defect data gives you the context you need to build a truly smart quality strategy.
How Do We Introduce Metrics Without Freaking Out the Team?
This is the big one. Your entire quality initiative lives or dies based on how the team feels about it. The secret is to frame metrics as helpful tools for developers, not as a report card for management. Position them as a way to spend less time on frustrating bugs, make code reviews less painful, and generally make everyone’s job easier.
The second you use metrics to compare developers or assign blame, the game is over. The focus has to stay on team-level trends and solving problems together. It’s about building a culture of shared ownership, not pointing fingers.
Here’s a simple playbook to get it right:
- Start Small: Don't boil the ocean. Pick one or two metrics that address a pain point everyone on the team already feels, like constant regressions or code reviews that drag on forever.
- Make It a Team Decision: Get everyone in a room (or a call) and talk about the "why." Decide together what thresholds make sense for your specific codebase.
- Focus on Trends, Not Scores: Use the data to start conversations in retros. Instead of asking "Who wrote this?", ask "This module's churn rate is high—what can we do as a team to stabilize it?"
- Automate Everything: This is non-negotiable. Integrate quality checks directly into your CI/CD pipeline. Feedback should come from an impartial, automated process, not a manager.
When your team sees that software code quality metrics let them spend less time debugging and more time building cool stuff, they'll become the biggest champions of the whole process.
Won't Focusing on Quality Metrics Slow Us Down?
This is probably the oldest myth in the book. The truth is, while there's a tiny upfront investment to get tools set up, focusing on quality actually makes you go faster in the long run. It's the key to sustainable velocity.
Poor quality is just technical debt in disguise, and that debt acts like an anchor on your team. It drags everything to a halt with endless bug-fixing cycles, unpredictable side effects, and changes that take forever. That "quick and dirty" fix you pushed last week is going to cost you ten times the hours in rework next quarter.
Think of it this way: an automated quality check might add 60 seconds to a pipeline build. But it can prevent hours—or even days—of frantic debugging when a critical issue pops up in production. The highest-performing engineering teams in the world have already proven it: high quality and high velocity aren't a trade-off. They're two sides of the same coin. Good quality is what makes speed possible.
Ready to put this into practice? kluster.ai brings real-time AI code review straight into your IDE, giving instant feedback on quality, security, and compliance as you write. Automate your standards, kill the PR back-and-forth, and empower your team to ship trusted, production-ready code faster. Start free or book a demo with kluster.ai today.