

Metric software testing: Boost Quality with metric software testing
Metric software testing is all about using hard numbers to measure and sharpen up your testing process. Forget gut feelings and guesswork. Think of it like a cockpit's instrument panel for your development pipeline—it gives you the critical data you need to make smart, informed decisions.
Why Metric Software Testing Is Your Engineering Compass

Imagine a pilot trying to fly a jumbo jet through a thick storm with no instruments. Even with years of experience, they're essentially flying blind, just reacting to turbulence as it hits. Shipping code without data is a lot like that.
These days, especially with so much AI-generated code flying around, intuition just isn't enough. Metric software testing provides that essential "instrument panel" your team needs to navigate the wild complexities of building great software.
From Reactive Bug Hunts to Proactive Quality Engineering
Testing used to be a last-minute scramble—a reactive hunt for bugs right before a big release. Now, the game has changed. The goal is proactive quality engineering, where data drives every single decision.
This means we’re moving beyond just counting bugs. We’re digging deeper to understand the story our metrics are telling. A data-driven approach helps answer the really important questions:
- Efficiency: Are our test cycles getting faster or are they bogging us down?
- Product Health: Are more critical bugs slipping into production?
- Process Bottlenecks: Where are the real logjams in our development process?
By giving you a clear, objective view of what’s happening, metrics transform QA from a final gatekeeper into a continuous practice that boosts quality from the very first line of code.
The Value of Actionable Insights
Let's be clear: the point isn't to generate pretty reports that nobody reads. It’s about uncovering actionable insights that help everyone, from individual developers to engineering leads.
When you have clear data on quality, you're not just improving code; you're doing better software project risk management. You're guiding your team to deliver what the business actually needs.
The industry gets it. The global software testing market is set to explode from $48.17 billion in 2025 to a whopping $93.94 billion by 2030. This massive growth isn't a coincidence—it shows a universal shift toward using precise measurement to keep up with complex apps and the flood of AI-assisted development.
The Core Software Testing Metrics That Truly Matter
In the world of software testing, it's dangerously easy to get lost in a sea of data. Dozens of potential indicators are vying for your attention, but tracking everything usually means you end up tracking nothing of value. The secret is to zero in on a handful of metrics that tell a clear, compelling story about your product's health and your team's effectiveness.
Think of these core metrics as your software's vital signs. They give you an immediate, at-a-glance understanding of your quality, helping you shift from vague feelings about progress to concrete, data-backed conversations. Let's break down the essential metrics that every engineering team should have on their dashboard.
Before we dive into the details, here’s a quick overview of the metrics we'll cover. This table summarizes what each one is for, how to calculate it, and where you can typically find the data you need.
Key Software Testing Metrics At a Glance
| Metric | Purpose | Formula | Primary Data Source |
|---|---|---|---|
| Test Coverage | Measures how much of your codebase is executed by tests. | (Lines of Code Executed by Tests / Total Lines of Code) * 100 | CI/CD Pipeline Logs |
| Test Pass Rate | Shows the percentage of tests that passed in a given run. | (Number of Tests Passed / Total Tests Executed) * 100 | Testing Framework / CI/CD |
| Defect Density | Standardizes bug counts by code size (e.g., per 1,000 lines). | Total Number of Defects / Code Size (in KLOC) | Bug Tracker & Version Control |
| MTTR | Tracks the average time to fix a bug from report to resolution. | Total Time Spent on Bug Fixes / Number of Bugs Fixed | Project Management System |
| Defect Escape Rate | Measures the percentage of bugs found by users after release. | (Bugs in Prod / (Bugs in Prod + Bugs in Pre-Prod)) * 100 | Bug Tracker |
This table is a great starting point, but the real power comes from understanding the story behind each number. Let's dig in.
Test Coverage
Test Coverage tells you what percentage of your codebase is actually being run by your automated tests. Picture it like a map showing which parts of your application have been explored and which remain uncharted territory.
High coverage doesn't automatically mean your code is bug-free, but low coverage is a massive red flag. It points to significant blind spots where bugs can hide completely undetected. You can usually pull this data straight from the output logs of your CI/CD pipeline after a test run. To really understand which indicators provide the most value, it helps to delve into Agile performance metrics that truly matter.
Test Coverage (%) = (Lines of Code Executed by Tests / Total Lines of Code) * 100
A healthy approach isn't chasing an arbitrary 100%. Instead, aim for high coverage (say, 80-90%) on your most critical business logic and complex modules, where the risk is greatest.
Test Pass Rate
The Test Pass Rate is one of the most immediate signs of your build's health. It’s simple: what percentage of tests passed successfully out of all the tests you just ran? A consistently high pass rate suggests stability. A sudden drop? That’s your first signal that a recent change has broken something.
This metric is your frontline diagnostic tool. If the pass rate dips, the team knows instantly that something is wrong and needs immediate attention. You’ll find this data right in your testing framework and CI/CD dashboard.
Test Pass Rate (%) = (Number of Tests Passed / Total Number of Tests Executed) * 100
Keep an eye on this trend over time. A pass rate that's consistently flaky or slowly declining often points to deeper, systemic problems like an unreliable test environment or mounting technical debt.
Defect Density
Defect Density gives you a standardized way to measure code quality. It calculates the number of confirmed bugs per unit of code, usually per 1,000 lines of code (KLOC). This helps you compare the quality of different modules or even different projects, apples to apples, regardless of their size.
If you see a high defect density in a particular part of your application, you’ve found a bug hotspot. That area probably needs some refactoring or more focused testing. To calculate it, you’ll need data from your version control system (like Git) for code size and your bug tracker (like Jira) for defect counts.
Defect Density = Total Number of Defects / Code Size (e.g., in KLOC)
A rising defect density is an early warning that your code's complexity might be outgrowing your team's ability to maintain its quality. For a deeper dive into this and other related indicators, check out our guide on software code quality metrics.
Mean Time To Resolution (MTTR)
Mean Time To Resolution (MTTR) measures the average time it takes for your team to fix a bug—from the moment it's reported to the second the fix is deployed. This is a critical metric for understanding your team's responsiveness and the overall efficiency of your debugging and deployment pipeline.
A short MTTR means you have a nimble, effective team that can quickly find, diagnose, and ship a fix. On the other hand, a lengthening MTTR can be a symptom of deeper problems:
- Growing Code Complexity: The codebase is becoming a tangled mess, making it harder to change things safely.
- Knowledge Gaps: The team doesn't have the expertise to fix bugs in certain areas.
- Inefficient Processes: You have bottlenecks in your CI/CD pipeline, review process, or deployment strategy.
MTTR = Total Time Spent on Bug Fixes (from report to resolution) / Number of Bugs Fixed
The data for MTTR comes from your project management and version control systems, which track the lifecycle of every bug ticket.
Defect Escape Rate
This might be the most important customer-facing metric of all. The Defect Escape Rate measures the percentage of bugs that slip through your internal testing and are discovered by users in production. These are the defects that "escaped." A high escape rate is a direct hit to user trust and satisfaction.
This metric is the ultimate litmus test for your entire testing strategy. It tells you exactly how effective your pre-release quality gates really are. You calculate it by comparing bugs found internally before a release to those found by users after the release.
Defect Escape Rate (%) = (Bugs Found in Production / (Bugs Found in Production + Bugs Found in Pre-Production)) * 100
Your goal should always be to drive this number as close to zero as possible. A rising escape rate is a serious alarm bell, telling you that your current testing practices are no longer enough to protect your users.
How to Integrate Metrics Into Your Daily Workflow
Defining the right software testing metrics is like picking a destination on a map. But integrating them into your workflow? That’s like building the car that actually gets you there. If you want data to be a natural part of your engineering culture, you have to embed collection and visualization directly into the tools your team already uses every day.
This means getting metric tracking out of spreadsheets and putting it right into the heart of your development lifecycle. The two most powerful places to do this are in your Continuous Integration/Continuous Deployment (CI/CD) pipeline and, even better, directly within the developer's Integrated Development Environment (IDE). By automating data collection at these key points, metrics stop being a chore and become a real-time feedback loop.
This infographic gives a great high-level view of the core metrics you can track in these workflows.
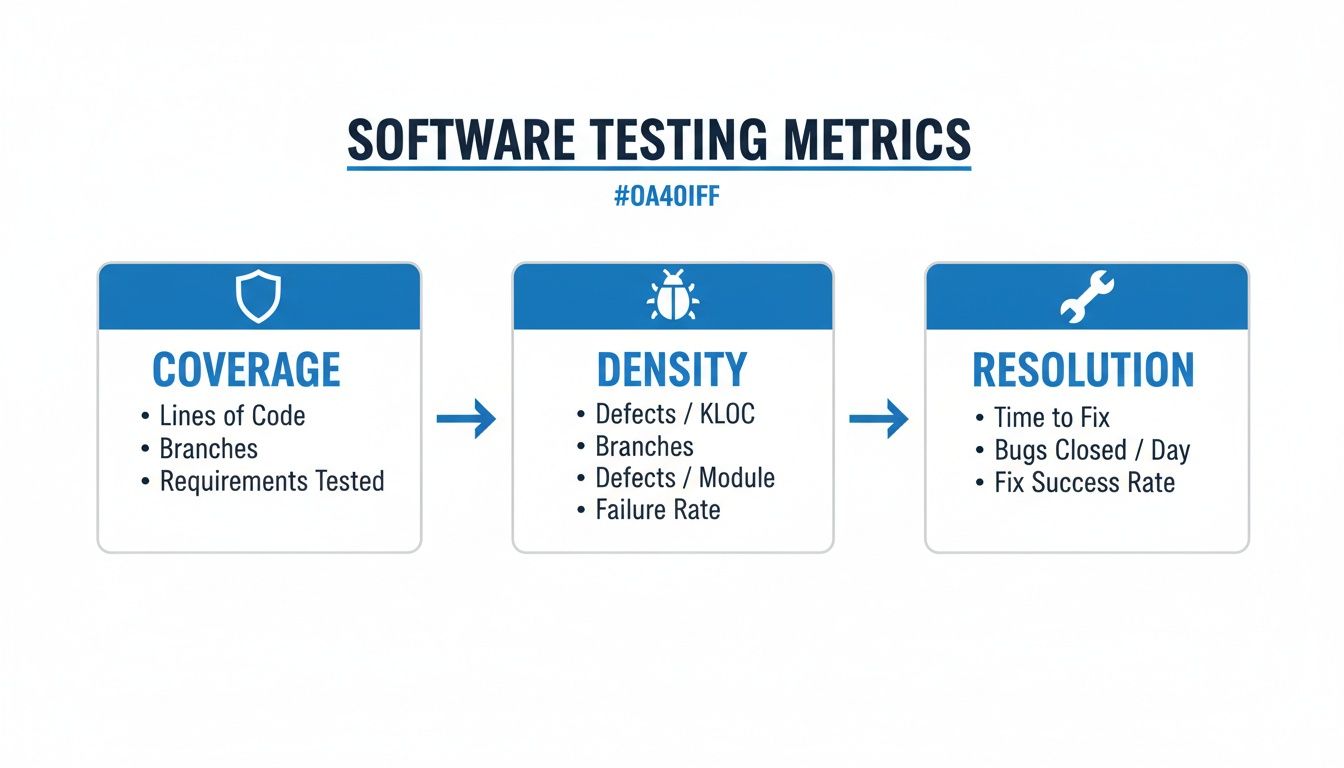
As you can see, things like test coverage, defect density, and issue resolution time all come together to paint a complete picture of your software's quality.
Automating Metrics in the CI/CD Pipeline
Your CI/CD pipeline is the central nervous system of your development process. Every time a developer pushes code, the pipeline kicks off a series of automated checks, making it the perfect spot to automate metric collection and capture fresh data consistently.
Tools like GitHub Actions, Jenkins, or GitLab CI can easily be set up to run your test suite and report back on key metrics with every single build. For instance, you can configure a job that automatically:
- Calculates Test Coverage: Using tools like JaCoCo or Istanbul, the pipeline can generate a coverage report. You can even set it to fail the build if coverage drops below a certain threshold.
- Logs Test Pass/Fail Rates: The test runner’s output gives you an immediate pass/fail count, which can be logged and piped into a dashboard for visualization.
- Publishes Results: These metrics can be sent to a monitoring service or posted directly into a team's Slack channel for instant visibility.
This kind of automation transforms software testing metrics from a manual, once-in-a-while task into a continuous, effortless process. The pipeline becomes your source of truth for build health and code quality over time.
Shifting Left with In-IDE Verification
While pipeline automation is a huge step up, it’s still reactive—it catches problems after the code has been written and committed. The modern approach is to "shift left," moving quality checks as early as possible. This is where in-IDE verification becomes a total game-changer.
By providing real-time feedback directly in the code editor, you empower developers to fix issues before they even create a pull request. This drastically reduces rework and ensures the data entering your pipeline is of higher quality from the start.
Tools like kluster.ai work right inside the IDE, acting as a real-time governance layer for your code—especially for AI-generated code. As a developer works, Kluster’s agents can instantly check code against repository context, security policies, and team best practices.
This pre-commit validation gives you immediate metrics on:
- AI-Generated Code Quality: Catching logical errors or "hallucinations" in seconds, not hours.
- Security Vulnerabilities: Flagging potential risks before they ever touch the codebase.
- Compliance with Standards: Making sure new code automatically follows your team's conventions.
This proactive feedback loop is becoming critical as automation spreads. The Software Testing and QA Services market is projected to grow from $50,672.4 million in 2026 to a staggering $107,248.0 million by 2033, a trend driven largely by the need for automated testing. With global test automation adoption already at 76.8%, making sure the code is solid before it hits the pipeline is the only way to make those investments pay off. You can find more insights on the growth of the software testing market here.
When you integrate metric collection into both the IDE and the CI/CD pipeline, you create a powerful, comprehensive system. The IDE provides immediate, preventative feedback to the developer, while the pipeline offers a broader, systemic view of quality trends for the entire team.
Common Pitfalls and How to Avoid Them
Software testing metrics are powerful, but they can be a real double-edged sword. Used right, they light the way to better quality and faster delivery. But when misused, they can create a toxic culture of fear, send your engineers chasing ghosts, and ultimately do a lot more harm than good.
Let's be honest, we've all seen it happen. The key is learning to spot the anti-patterns before they take root and knowing how to steer your team toward genuine improvement instead of just hitting numbers.
The Danger of Weaponizing Metrics
One of the fastest ways to kill team morale is to turn metrics into a weapon against individual developers. This is what happens when managers start using data like individual bug counts or code coverage contributions as the main yardstick for performance reviews.
The moment metrics become a weapon, the game changes. Developers naturally stop focusing on writing great software and start focusing on optimizing their numbers. This leads to all sorts of bad habits:
- Hiding Bugs: Why report a bug if it’s going to make you or your teammate look bad? It’s safer to just ignore it.
- Arguing Over Trivial Defects: Teams burn hours debating whether a minor UI glitch "counts" as a bug just to protect their stats.
- Writing Useless Tests: When the only goal is a coverage target, you get tests that assert nothing of value. They just run code to make a percentage go up.
The result is a culture of fear. Your dashboards might look great, but the actual quality of your product is quietly taking a nosedive.
Chasing Vanity Metrics
Not all metrics are created equal. A vanity metric is a number that looks impressive on a slide deck but tells you absolutely nothing about your business or your product's health. In the world of metric software testing, the most infamous vanity metric is the obsessive pursuit of 100% test coverage.
Look, high test coverage is generally a good thing. But blindly chasing that perfect score is usually a massive waste of time. I've seen teams spend weeks writing convoluted tests for simple, stable, low-risk parts of the app just to nudge their coverage from 98% to 100%.
That same engineering effort could have built robust integration tests for a critical new feature or fixed a dozen high-impact bugs. The goal isn’t a perfect number; it's a perfect user experience.
Instead, take a risk-based approach. Focus your efforts on achieving high coverage for the most complex and business-critical modules—the places where a bug would cause the most damage.
The Misleading Nature of Averages
Relying only on averages for performance metrics, like Average Response Time, can be incredibly deceptive. An average is great at hiding extreme outliers that signal serious trouble.
Imagine this: most of your users get a zippy one-second response time, but a small 5% are stuck waiting a painful 20 seconds for the page to load. The average response time might still look perfectly fine, completely masking the fact that a chunk of your user base is having a miserable experience.
To avoid getting fooled, always look beyond the simple average. You need other stats to get the full picture:
- Percentiles (p90, p95, p99): These tell you about the experience of the vast majority of your users, not just the mathematical middle. A solid Service Level Agreement (SLA) might promise that 95% of requests will complete in under 500ms.
- Standard Deviation: This tells you how consistent your performance is. A high standard deviation means your response times are all over the place—unpredictable and unreliable.
By supplementing averages with percentiles and standard deviation, you get a much more honest view of your system's performance. You can ensure a consistent, reliable experience for almost everyone, not just the "average" user. At the end of the day, metrics should be tools for collective improvement, not instruments of individual judgment.
Improving Metric Accuracy with In-IDE Verification

There’s an old data science mantra that fits metric software testing perfectly: "garbage in, garbage out." If your process lets buggy, insecure, or just plain sloppy code into the CI/CD pipeline, your metrics are going to be a mess. They won’t show real progress; they’ll just reflect a state of constant firefighting.
A high Defect Density or a stubborn Mean Time to Resolution (MTTR) doesn't always mean your testing strategy is broken. It often points to a problem further upstream—the quality of code being committed in the first place. This is where catching issues directly in the IDE becomes a game-changer for data integrity.
The Rise of AI and the Need for Governance
AI code assistants are everywhere now, and for good reason. They can generate complex functions in seconds. But that speed comes with a hidden tax. AI models are notorious for introducing subtle bugs, logical mistakes, security holes, and performance issues that even a sharp developer can easily miss when moving fast.
Without a governance layer, all that AI-generated code flows straight into your pipeline, creating a ton of noise in your metrics. Every AI "hallucination" or vulnerability caught later inflates your bug counts and rework rates, making it impossible to get a true read on engineering velocity. Your team ends up burning time fixing AI mistakes instead of shipping features.
This is the central challenge for modern software testing metrics: how do you ensure the code being measured is high-quality before it even becomes a pull request? The answer is to shift verification all the way to the left, right inside the developer's IDE.
Tools like kluster.ai provide this real-time governance, acting as an intelligent verification layer inside the development environment. It goes way beyond simple syntax checking. It understands what the developer is trying to accomplish and validates the AI's output against that intent.
How In-IDE Verification Cleans Your Data
Let’s walk through it. Imagine a developer uses an AI assistant to write a new data processing function. In a typical workflow, any problems would only surface during code review or automated testing, skewing your metrics downstream. With an in-IDE verification tool, the process is completely different.
As the AI generates the code, a tool like Kluster instantly analyzes it against critical context:
- Repository History and Docs: Does this new code follow existing patterns in your codebase?
- Security Policies: Does it introduce a known vulnerability or violate one of your security rules?
- Performance Standards: Could this function create a bottleneck or chew up memory?
- Developer Intent: Is the code actually doing what the developer asked the AI to do?
This whole check happens in seconds, right in the IDE. For more on improving your processes within the IDE, check out our guide on calculating code coverage in IntelliJ and other environments.
This immediate feedback loop stops flawed code from ever being committed. By catching these problems pre-commit, you are fundamentally cleaning the data that feeds your entire metric software testing program.
The benefits are direct and easy to see:
- Reduced Defect Escape Rate: Bugs are caught at the source, so far fewer make it into testing, let alone production.
- Lower MTTR: When bugs are found, they're fixed on the spot. The resolution time for a whole class of common errors drops to nearly zero.
- Accurate Defect Density: Your bug counts start reflecting genuine, complex issues, not simple AI goofs that should have been caught hours or days earlier.
Metrics That Reflect True Progress
When you implement in-IDE verification, your software testing metrics finally start telling a true story. A stable Test Pass Rate isn't hiding a shaky foundation; it reflects genuine stability. A low Defect Density becomes a real badge of engineering excellence, not just a lucky streak.
This proactive approach is becoming essential. Research shows the length of tasks AI agents can reliably complete has been doubling roughly every seven months. As AI starts tackling more complex, multi-day tasks, the need for automated, real-time verification is only going to intensify.
Ultimately, building verification into the IDE ensures your metrics are more than just numbers on a dashboard. They become a reliable compass for guiding your team, reflecting real progress, and helping you build a culture of quality from the very first line of code. This shift—from reactive measurement to proactive governance—is how you unlock trustworthy, actionable insights from your testing data.
Common Questions About Software Testing Metrics
Jumping into a data-driven approach always kicks up a few questions. From figuring out where to even start, to handling team dynamics and the impact of new tech, getting clear answers is everything. Here are the most common questions we hear about building a smart software testing strategy.
What Is the Best Metric to Start With?
If you're just starting out, don't try to boil the ocean. Begin with the Defect Escape Rate.
This one metric tells you how many bugs slip through your process and get discovered in production. It’s a direct measure of the quality your users are actually experiencing, which makes it a powerful number that gets everyone on the same page, from engineers to the C-suite. It’s all about customer impact.
Once you have a good handle on that, you can start layering in other metrics. The Test Pass/Fail Rate gives you a quick, at-a-glance signal of build health. Then, add Mean Time to Resolution (MTTR) to see how quickly your team is actually fixing the problems that pop up.
How Do We Stop Our Team from Gaming the Metrics?
This is a huge—and hugely important—culture question. The most effective way to stop people from gaming the system is simple: never, ever tie metrics to individual performance reviews.
The moment you do, you've lost. When things like bug counts or code coverage become a tool for judgment, people will naturally find ways to make their numbers look good instead of focusing on what actually improves quality. It’s a classic anti-pattern that breeds fear and completely undermines why you started tracking data in the first place.
Instead, frame your metrics as conversation starters for team retrospectives. It’s about trends, not raw numbers. If test coverage dips, the question isn’t "Whose fault is this?" It should be, "What happened here?" Was it because of a gnarly new feature? A crazy deadline? A gap in our process?
The goal is to build a culture of shared ownership over quality. Metrics should be tools for learning and improving together, not weapons for assigning blame.
How Do AI Code Assistants Change Software Testing Metrics?
AI code assistants make "shift-left" metrics more critical than ever. The old-school pipeline metrics like Defect Density still have their place, but the real action is shifting to proactive, real-time measurements right inside the IDE.
You now need to track problems that are unique to AI, like the rework rate on generated code or how often AI "hallucinates" and produces buggy logic.
This is where modern verification platforms come in. They give you instant feedback on security flaws, compliance gaps, and logical errors in the AI-generated code before it’s ever committed. This approach stops bad code from ever polluting your test cycles, which means your downstream pipeline metrics become far more reliable and meaningful. You're ensuring data integrity from the very first line of code.
Should Our Goal Be 100 Percent Test Coverage?
Chasing 100% test coverage is almost always a vanity metric. It looks fantastic on a dashboard but rarely translates into a better product. The engineering hours spent pushing from 98% to 100% coverage on some trivial, low-risk utility function are almost always better spent somewhere else.
A much smarter approach is to think in terms of risk. Aim for high coverage, sure—something like 80-90% is a great target—but concentrate that effort on the parts of your application that truly matter:
- Complex business logic that’s core to what your product does.
- Frequently changed modules where the risk of regressions is highest.
- Areas of the codebase with a history of high defect rates.
Use your testing resources like a surgeon, not a sledgehammer. Focus on preventing high-impact bugs where they’re most likely to happen, rather than chasing an arbitrary number that doesn't guarantee real-world quality.
By verifying AI-generated code in real-time before it ever leaves the IDE, kluster.ai helps you ensure your software testing metrics are accurate and trustworthy. Catch hallucinations, security flaws, and logic errors in seconds to build a foundation of quality from the start. Book a demo to see it in action.