

What Is Code Coverage: A Quick Guide to Software Quality
At its core, code coverage is a simple metric that answers a critical question: what percentage of your code is actually being run by your automated tests? Think of it like a building inspector checking every single room and closet, not just peeking through the front door.
That percentage gives you a clear view of potential blind spots where bugs can hide, making it a cornerstone of modern software quality.
Understanding Code coverage and Why It Matters
Imagine pushing a new feature live without any idea if the most critical parts were ever tested. That's exactly the kind of gamble code coverage helps you avoid. It’s not some vanity metric to pretty up a dashboard; it’s a practical tool that gives you a hard number on how thorough your test suite really is. By shining a light on untested code, it gives developers real confidence that their changes won't break something unexpected.
Low coverage creates dangerous blind spots. These are the dark corners of your codebase where bugs love to fester, eventually leading to production failures, frantic hotfixes, and a mountain of technical debt. On the flip side, high code coverage acts as a safety net. It allows teams to refactor and ship new features more aggressively, knowing a solid suite of tests is there to catch any regressions before they cause chaos.
The Foundation of Software Quality
In today's world of rapid development cycles, speed can't come at the cost of quality. Code coverage is a key practice that helps teams strike that balance. Here's how:
- Reveals Untested Code: It pinpoints the exact lines, branches, or functions that your tests are completely missing.
- Boosts Developer Confidence: There's nothing like seeing high coverage on the code you just changed to feel good about merging a pull request.
- Improves Code Maintainability: A codebase with solid test coverage is infinitely easier and safer to refactor and maintain over the long haul.
- Enhances Security: While not a security scanner, coverage ensures that your security-related logic is actually being run by tests. High code coverage is a major contributor to overall software quality, which is an essential piece of broader IT security considerations.
A high coverage score often says more about a team's discipline than anything else. It's a signal of an engineering culture that's committed not just to shipping features, but to shipping reliable software that lasts.
This metric is so important that industry benchmarks have started to form around it. One landmark study of 47 different software projects found an average code coverage of 74-76% in codebases that were, on average, over 8,000 lines long. This tells us that even on mature projects, getting comprehensive test coverage is a real challenge that requires focus. You can discover more insights about these code coverage findings on launchdarkly.com.
Ultimately, code coverage creates an indispensable feedback loop for the entire team—engineers, managers, and even security—to build more resilient and trustworthy software.
The Four Main Types of Code coverage Metrics
Your overall code coverage percentage is a great starting point, but that one number doesn't tell the whole story. To really get a feel for how effective your tests are, you need to dig into the different types of coverage metrics. Each one is like a different lens, revealing specific details about how thoroughly your tests are actually exercising your code.
Think of it like this: a high-level map shows you the country, but you need a street-level view to see individual houses. Different coverage metrics give you different levels of granularity, moving from a broad overview to the nitty-gritty of your code's logic.
This concept map gives a clear picture of what's at stake.
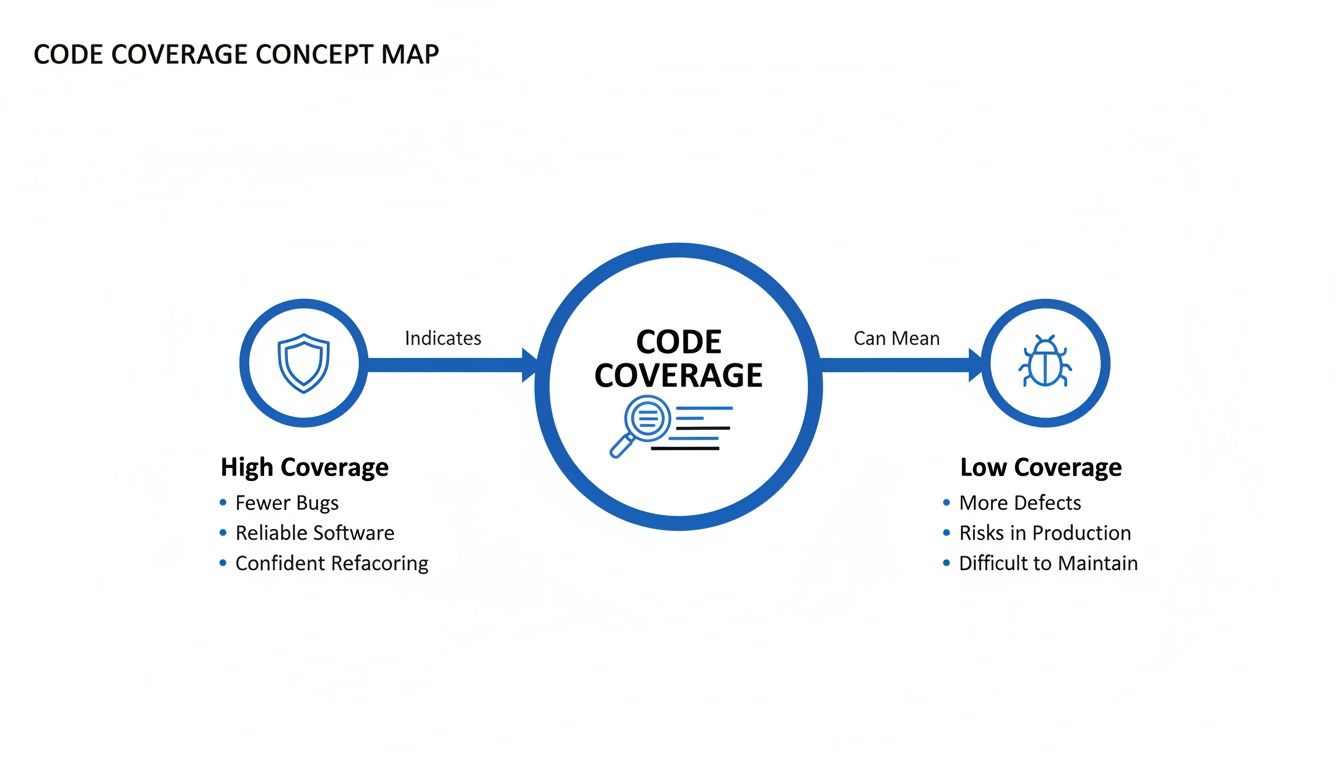
As you can see, high coverage acts as a shield against bugs, while low coverage leaves your application vulnerable. Let's break down the four primary metrics that help you build that shield.
The table below provides a quick breakdown of the four primary code coverage types, what they measure, and why they matter. Each metric offers a unique perspective on your test suite's effectiveness, helping you move from a vague percentage to actionable insights.
Comparing Code Coverage Metrics
| Coverage Type | What It Measures | Example | Key Benefit |
|---|---|---|---|
| Statement Coverage | Whether each executable line of code has been run at least once. | A single test that runs through a simple function without any if statements. | Good for quickly finding completely unused "dead" code. |
| Function Coverage | Whether each function or method in your codebase has been called. | A test that calls a calculate_total() function, even just once. | Ensures no major functionality is completely untested. |
| Branch Coverage | Whether every possible outcome of a decision point (like if/else) has been tested. | Two tests for an if statement: one for the true path and one for the false path. | Drastically reduces bugs hidden in conditional logic by forcing tests for all paths. |
| Line Coverage | How many executable lines of code were run. Often used interchangeably with Statement Coverage. | Similar to statement coverage, it highlights lines in green (covered) or red (missed). | Provides a simple, visual way to see which specific lines lack test coverage. |
While each metric has its place, they aren't created equal. Some give you a false sense of security, while others force you to write much more robust tests. Let's dive a little deeper into each one.
Statement and Line Coverage: The Basics
Statement Coverage is the simplest metric of all. It asks a straightforward question: was this line of code executed by a test? It measures the percentage of executable statements in your code that have been run at least once. Line Coverage is very similar and often used interchangeably, measuring how many lines of executable code were touched.
For example, take this function:
def calculate_price(base_price, tax): total = base_price * (1 + tax) print(f"Total price is: {total}") return total
A single test calling this function with any valid numbers would achieve 100% statement and line coverage. Every line would be executed. But its simplicity is also its biggest weakness—it doesn't care about the logic within a line, especially when decisions are involved.
Function Coverage: The 30,000-Foot View
Function Coverage (or Method Coverage) is another high-level metric. It just tracks which functions in your code have been called by your tests. If your test suite calls a function even once, it’s considered covered.
This is useful for making sure no major piece of functionality is completely ignored. However, like statement coverage, it's pretty shallow. A test could call a function but completely fail to exercise its critical logic, edge cases, or error handling.
Branch Coverage: Where the Real Insight Is
This is where code coverage starts to get much more valuable. Branch Coverage (or Decision Coverage) measures whether every possible outcome of a decision point—like an if statement or a switch case—has been tested.
Let’s look at this example:
def check_access(user_role): if user_role == "admin": return "Access Granted" else: return "Access Denied"
You could get 100% statement coverage with a single test where user_role is "admin". But to hit 100% branch coverage, you need two separate tests:
- One where the
ifcondition is true (user_role == "admin") - Another where the
ifcondition is false (e.g.,user_role == "guest")
This forces you to test both the "happy path" and the alternative scenarios, which is critical for catching bugs hiding in conditional logic. For this reason, many experienced teams consider branch coverage the most practical and important metric for day-to-day development.
How to Measure and Improve Your Code Coverage
Knowing the different types of code coverage is a good start, but turning that knowledge into action is what really matters. It's time to get practical and weave coverage analysis right into your day-to-day development workflow. This boils down to picking the right tools, automating everything you can, and being strategic about improving your score.
The first step is choosing a tool that plays nicely with your tech stack. Just like you wouldn't use a hammer to drive a screw, you need a coverage tool built for your specific programming language. These tools work by "instrumenting" your code—think of it as adding tiny little trackers that watch which lines, branches, and functions get hit when your tests run.
This isn't just a niche practice anymore; it's a massive industry trend. The global code coverage tools market was valued at USD 672 million and is expected to explode to USD 2,077 million by 2033. That's a 14.7% annual growth rate, which tells you just how critical automated testing has become in modern software shops.
Choosing the Right Coverage Tool
Picking the right tool is the key to getting reports that are actually useful. Thankfully, the ecosystem is pretty mature, so there are solid, well-supported options for almost any language you can think of.
Here are a few of the heavy hitters for different environments:
- For Java: JaCoCo is the modern standard. It plugs right into build tools like Maven and Gradle and spits out beautiful HTML reports that are easy to dig through.
- For JavaScript/TypeScript: Istanbul (now called nyc) is the king of the hill in the Node.js and frontend world. It works perfectly with popular testing frameworks like Jest and Mocha.
- For Python: Coverage.py is the go-to choice for virtually all Python developers. It's dead simple to use and gives you clear outputs on the command line or in an HTML report.
Once you get one of these set up, it will run alongside your test suite and generate a report showing exactly what your tests touched—and, more importantly, what they missed.
Integrating Coverage into Your CI/CD Pipeline
Running coverage reports on your local machine is fine, but the real magic happens when you automate it. By plugging these tools into your Continuous Integration/Continuous Deployment (CI/CD) pipeline, you make coverage a visible, non-negotiable part of every single code change.
Platforms like GitHub Actions, Jenkins, or GitLab CI can be set up to:
- Run Tests Automatically: Every time a developer pushes code, the CI server kicks off the full test suite. No excuses.
- Generate a Coverage Report: Right after the tests finish, your tool generates a fresh report based on that run.
- Enforce Quality Gates: This is the big one. You can set rules that fail the build if coverage drops below a certain number (say, 80%). This literally stops untested code from getting merged. If you want to see how this works in practice, you can learn more about setting up code coverage in GitLab.
This automated feedback loop transforms code coverage from something you check once in a while into a real-time health monitor for your codebase. It builds a culture where everyone on the team owns quality.
Actionable Strategies for Improving Coverage
With your measurement and automation in place, the last piece of the puzzle is actually improving your score. Remember, the goal isn't just to chase a high number; it's to write better, smarter tests that protect what matters.
Here are a few proven ways to boost your coverage effectively:
- Focus on Critical Code First: Don't boil the ocean. Your coverage report is a treasure map showing you exactly where the riskiest, untested code lives. Start with things like payment processing, authentication logic, or your core business algorithms.
- Adopt Test-Driven Development (TDD): The whole point of TDD is to write a failing test before you write the code to make it pass. This naturally produces high-coverage code because you literally don't write a line of production code unless a test demands it.
- Write Tests for Every Bug Fix: When you fix a bug, your first step should be to write a test that reliably reproduces it. Once you see that test fail, then you write the fix. This guarantees the bug stays dead and never creeps back into the codebase.
By combining the right tools with smart automation and a focused strategy, you can build a sustainable process that doesn't just measure coverage—it consistently improves the quality and reliability of your software.
Ah, the million-dollar question: what’s a "good" code coverage score? It’s one of the most heated debates in software development, and it's easy to get fixated on that perfect 100%. But let me tell you from experience—chasing perfection here is almost always a mistake.
Going all-out for 100% coverage often leads teams down a rabbit hole. You end up writing brittle, low-value tests just to bump up a number. This doesn’t just slow down development; it actually adds very little in terms of real quality. It's a classic case of diminishing returns.
The truth is, not all code is equally important. The time it takes to cover those last few percentage points—testing simple getters and setters, for instance—is time that could be spent on much more impactful work. A better way to think about it is strategically. Focus your testing energy where it will do the most good.
Adopt a Risk-Based Approach
Instead of obsessing over a single, universal number, the best engineering teams I've worked with use a risk-based framework. It’s a simple but powerful idea: you don't hold every part of your codebase to the same standard. You figure out what’s critical, what’s standard, and what’s low-risk, and then you set different goals for each.
This pragmatic approach makes sure your developers' time—your most valuable resource—is spent shoring up the parts of your application that truly matter. Here’s how it might look in practice:
- Critical Business Logic (90%+ Coverage): This is your crown jewels. Think core algorithms, payment gateways, authentication flows—anything that would cause a major headache if it broke. For this code, a high threshold isn't just nice to have; it's non-negotiable.
- Standard Features (80-85% Coverage): This is the bread and butter of your application. An 80% target is a fantastic, realistic goal here. It ensures most of the logic is solid without chasing perfection.
- Low-Risk Components (70%+ Coverage): This bucket might include simple UI components, helper functions, or third-party integrations where you don't control the internal logic anyway. A lower threshold here is perfectly fine.
By setting tiered goals, you change the entire conversation. It’s no longer about "How much code did we cover?" but "Did we cover the right code?" The focus shifts from hitting a percentage to actually managing risk.
This flexible strategy is backed by what we see across the industry. While 100% sounds great on paper, most experts agree that a healthy range of 70-90% is the sweet spot for most applications. A broad look at industry standards shows 80% is widely considered a strong and achievable benchmark. Google, for example, sees 80% as a solid goal. The only time you really see a push for 100% coverage is in life-or-death systems—think avionics or medical device software—where regulations demand it. If you want to dive deeper, you can read more about code coverage best practices.
Moving Beyond a Single Number
At the end of the day, your code coverage goal should be a tool that encourages good habits, not a weapon to enforce arbitrary rules. The right target for your team will depend on your project’s maturity, your business’s appetite for risk, and the sheer complexity of your codebase.
The key is to start with a baseline, set realistic tiered goals, and bake coverage analysis right into your CI/CD pipeline. When you do that, quality becomes a shared responsibility, and testing becomes a strategic activity instead of a chore. By focusing on the quality and intent of your tests, not just the raw percentage, you’ll build a product that’s resilient, maintainable, and reliable.
The Hidden Dangers of Misinterpreting Coverage Scores
A high code coverage score feels great, right? It’s like a badge of honor, a neat percentage that seems to prove your codebase is well-tested and solid. But if you take that number at face value, it can be dangerously misleading. It offers a false sense of security, masking critical blind spots that a raw percentage can never reveal.
The biggest danger comes down to one crucial distinction: the difference between code that is simply executed and code that is properly verified. A test can run through a line of code, turning it green in your coverage report, but that doesn't mean it actually checked for the correct outcome. It’s like a delivery driver visiting every house on a street but never confirming they dropped off the right package.

This is everything. Your coverage metric doesn't know or care about the quality of your test assertions. Weak or nonexistent assertions are the number one reason a high score can be a complete mirage.
Executed vs. Verified Code
Think about a simple function that calculates a discount. A test could call this function and easily hit 100% line coverage. But if that test doesn't include an assert statement to confirm the discount amount is actually correct, it hasn't verified a thing. The code ran, sure, but its logic is completely unchecked.
This is a common trap. Teams chasing a percentage often write tests that just "touch" the code without any meaningful validation. The score goes up, but real software quality flatlines, leaving the door wide open for subtle logic errors to sneak into production.
“Chasing 100% code coverage can create a false sense of security while diverting effort from meaningful testing. A smarter strategy is focusing on high-risk areas with unit tests and ensuring integration tests validate how components work together."
This gets to the heart of it: the quality of your test assertions matters far more than the quantity of lines covered.
Blind Spots Your Coverage Score Can’t See
Beyond weak assertions, a bunch of other problems can make a standalone coverage number unreliable. These are the blind spots that even a 95% score can completely miss.
- Logical Flaws and Edge Cases: Coverage can't tell you if your algorithm is just plain wrong. If the logic is flawed but the code runs without crashing, your tests will pass, and your coverage will look fantastic. It also won't flag that you've missed crucial edge cases, like handling null inputs or division by zero.
- Performance Bottlenecks: A test can execute a function and confirm its output, but it has no idea if that function is slow, inefficient, or hogging memory. Performance testing is a whole separate discipline that coverage metrics are completely blind to.
- Security Vulnerabilities: High coverage absolutely does not equal secure code. A test suite can achieve 100% coverage on a login function without ever checking for common vulnerabilities like SQL injection or cross-site scripting (XSS).
- Flaky Tests: Those frustrating, intermittent tests that sometimes pass and sometimes fail can artificially inflate your coverage score. If a flaky test happens to pass during the coverage run, it contributes to the total, masking deep-seated reliability problems in your test suite itself.
At the end of the day, a code coverage score is a diagnostic tool, not a certificate of quality. It’s brilliant at one thing: telling you what you haven't tested and pointing you toward the dark, untouched corners of your codebase. But it says very little about the quality, correctness, or security of the code you have tested. Use it as a guide to find untested code, but always prioritize writing meaningful, robust tests that verify real behavior over just chasing a number.
How Modern Tools Reinforce Your Code Coverage Strategy
Code coverage is fantastic, but it only answers one question: "What parts of my code did my tests not run?"
It stays completely silent on a much more important question: "Is the code that did run actually correct?" A 100% coverage score can easily hide logic errors, performance nightmares, and glaring security vulnerabilities in plain sight.
This is the gap where the next layer of software quality comes in, especially now that AI is writing so much of our code. While your tests are great for verifying the final output, a new class of tools works much earlier in the process. They act as a powerful partner to your coverage strategy by zeroing in on code quality before the testing phase even kicks off.
These tools give you real-time analysis right inside your IDE, catching subtle issues that coverage metrics were never designed to see.
Proactive Quality Control in Your IDE
The best way to improve code quality is to catch mistakes the moment they’re written. Period. Instead of waiting for a CI pipeline to fail minutes or hours later, developers get instant feedback on the code they—or their AI assistants—are generating.
This proactive approach is all about shifting quality "left," making it a core part of the creation process, not an afterthought. For example, an AI code review platform can check for:
- Logic Errors: Does the AI-generated function actually do what the developer intended?
- Performance Issues: Is there a much more efficient way to write this query to avoid future bottlenecks?
- Security Vulnerabilities: Does the code introduce classic risks like SQL injection or leaky error handling?
By flagging these problems immediately, these tools ensure the code heading to your CI pipeline is already a cut above. This makes hitting meaningful test coverage targets much easier, because you're not wasting time writing tests for fundamentally broken or insecure code. When you're dealing with a complex system, getting this early feedback is a game-changer. You can learn more about how to get detailed code coverage in IntelliJ and other IDEs in our guide.
Aligning AI-Generated Code with Your Standards
Modern development teams are leaning heavily on AI coding assistants, but let's be honest—their output can be wildly inconsistent. Tools like kluster.ai tackle this head-on by checking AI-generated code against your project's specific context, documentation, and even your team’s unwritten coding conventions before it ever gets committed.
This in-IDE verification acts as a critical guardrail. It ensures that every piece of AI-generated code is not just functional but also secure, efficient, and aligned with your organizational standards from the very start.
This creates a powerful synergy. Your code coverage tools confirm your logic is being exercised by tests, while real-time AI review tools confirm the logic itself is sound and secure. This dual approach moves you beyond just measuring test execution and toward a more holistic view of software quality, ensuring every line of code is both tested and trustworthy.
Common Questions (and Misconceptions) About Code Coverage
When teams first start tracking code coverage, the theoretical concepts quickly bump into real-world questions. It's one thing to read about it, but another to get it working day-to-day. Let's clear up some of the most common hurdles and myths.
"If We Hit 100% Coverage, Does That Mean Our Code Is Bug-Free?"
Not a chance. This is easily the most dangerous assumption teams make.
Hitting 100% coverage simply means your tests executed every line of code. It says absolutely nothing about whether the code did the right thing during that execution. You could have tests with zero meaningful assertions that still achieve perfect coverage.
Think of it like a checklist for a delivery driver. They might visit every house on the street, but that doesn't mean they delivered the correct package to each one. High coverage is a fantastic indicator of test discipline, but it’s no guarantee of quality.
"What’s the Best Way to Start Improving Our Coverage Score?"
Don't boil the ocean. Start by getting a baseline, then focus on what matters most.
First, you need a tool to measure where you are right now—you can't improve what you can't see. Once you have that number, resist the urge to fix everything at once. Instead, pick your battles. Focus your initial efforts on the most critical parts of your application, like core business logic, authentication flows, or payment processing.
A great practical strategy is to set a reasonable threshold (say, 85%) for all new code and bug fixes. This stops the bleeding immediately. From there, you can chip away at the older, high-risk parts of the codebase over time.
Key Takeaway: The goal isn't a perfect score overnight. It's about making incremental, high-impact improvements. Prioritize new and critical code first to build a sustainable quality culture without slowing down momentum.
"Will Focusing on Code Coverage Slow Us Down?"
There’s a small learning curve, but it’s an investment that pays for itself almost immediately.
Think of good test coverage as an automated safety net woven directly into your CI/CD pipeline. It catches bugs early, long before they morph into nasty, time-sucking production fires. You end up spending far less time on manual regression testing, frantic hotfixes, and late-night debugging sessions.
The time you save by preventing just one major production outage will almost certainly outweigh the initial effort of writing solid tests. It's a fundamental shift from reactive firefighting to proactive quality engineering, and that's what truly speeds up development in the long run.
While code coverage tells you what’s tested, it can’t tell you if the code is correct. kluster.ai complements your testing strategy by running real-time AI code reviews in your IDE, catching logic errors, security vulnerabilities, and performance issues before they even reach your test suite. Ensure every line of AI-generated code is production-ready from the start. Start free or book a demo to see it in action.