

A Developer's Guide to the Dynamic Code Analyzer
A dynamic code analyzer is a type of software testing tool that does something pretty clever: it inspects your application while it's actually running. Think of it as a real-time inspector on the factory floor, watching how your code behaves in a live environment to catch runtime errors, security holes, and performance drags that you'd never see on paper.
Demystifying the Dynamic Code Analyzer

Let's break this down without the dry, technical jargon. Imagine static analysis is like proofreading a movie script. You're checking for typos, grammatical mistakes, and structural problems on the page.
A dynamic code analyzer, on the other hand, is like watching the live performance. It’s looking to see if an actor forgets a line, trips over a prop, or just plain messes up their interaction with another character.
This "live performance" check is what makes dynamic analysis so incredibly useful. It puts your code through its paces in its natural habitat, revealing problems that only pop up under the stress of a real-world workload.
Why Runtime Analysis Is a Must-Have
Code can look perfect on paper and still fail in spectacular ways. This is becoming a huge issue with the rise of AI-generated code, where subtle logic flaws can hide behind syntactically flawless code. A dynamic analyzer is your safety net, catching the kinds of issues that static tools simply can't see.
The core value of a dynamic code analyzer is its ability to validate behavior, not just structure. It answers the question, "Does the code do what it's supposed to do securely and efficiently?" instead of just "Is the code written correctly?"
This approach is essential for finding a whole class of problems. A dynamic analyzer truly shines when it comes to:
- Runtime Errors: Catching things like memory leaks, null pointer exceptions, and race conditions that only show up when the code is in motion.
- Performance Bottlenecks: Pinpointing slow functions, inefficient database queries, and other resource hogs that kill the user experience.
- Security Vulnerabilities: Exposing flaws like cross-site scripting (XSS) or SQL injection that depend entirely on user input and the application's current state.
The Growing Need for Dynamic Tools
The demand for these tools is exploding for a reason: runtime security is no longer a "nice-to-have." The dynamic code analysis software market, valued at USD 732.41 million in 2025, is expected to skyrocket to USD 1,677.68 million by 2035.
This incredible growth, detailed in recent findings on market growth and trends, underscores how complex modern applications have become. Old-school checks just don't cut it anymore. For today's development teams, dynamic analysis isn't an option—it's a core part of any serious quality assurance strategy.
Static vs Dynamic Analysis in Practice

When you pit static and dynamic analysis against each other, it's easy to fall into the "which one is better?" trap. But that’s the wrong question. They aren't competitors fighting for the same spot in your toolbox; they’re partners, each designed for a different job at a different time.
The key is knowing when to use which, because a solid quality strategy relies on both.
Think about building a skyscraper. Static analysis is the architect poring over the blueprints. Before a single piece of steel is in place, they're checking for structural weaknesses, code violations, and anything that looks off on paper. It's a critical pre-construction check.
Dynamic analysis? That’s the earthquake stress test on the finished building. You shake the structure, overload its systems, and see what happens under real-world pressure. This test reveals flaws that were impossible to spot on the blueprints—problems that only show up when everything is working together.
The Architect vs The Stress Test
Static Application Security Testing (SAST) is that architectural review. It scans your source code, binaries, or bytecode without executing it. This makes it incredibly fast and perfect for the earliest stages of development, often right inside a developer’s IDE.
The advantage here is huge. Catching a security flaw before the code is even committed saves a massive amount of time and money compared to fixing it post-deployment. This is where tools like the Sonar static code analyzer come in, acting as your first line of defense.
On the other hand, Dynamic Application Security Testing (DAST) is our stress test. It works on a running, breathing application. A dynamic code analyzer couldn’t care less about your elegant code structure; it only cares about behavior. It actively pokes and prods your software from the outside, simulating real attacks and weird user inputs to see what breaks.
Key Practical Distinctions
The core difference is when and how they work. SAST is a "white-box" approach because it sees everything—the entire internal structure of your code. DAST is a "black-box" approach, testing the app without any inside knowledge, just like a real-world attacker would.
This leads to a few critical differences in your day-to-day workflow:
- Timing: SAST runs early and often, ideally on every single code change. DAST happens much later, usually in a staging or QA environment once the application is fully up and running.
- Environment: SAST just needs the source code. DAST needs a fully deployed application, complete with its database, APIs, and other dependencies.
- Scope: SAST is fantastic at finding things like potential SQL injection patterns or insecure library usage right in the code. DAST excels at finding runtime issues like broken authentication, server misconfigurations, and vulnerabilities that pop up from the interaction between different services.
By combining both approaches, teams create a powerful feedback loop. Static analysis secures the code as it's written, and dynamic analysis validates the security of the final, running product. One without the other leaves significant blind spots.
For example, a SAST tool might flag a function as being potentially vulnerable to SQL injection. A DAST tool can then try to actually exploit that vulnerability in the running application to confirm if it’s a real, measurable threat or just a false positive.
Static Analysis (SAST) vs Dynamic Analysis (DAST)
This table breaks down the core differences to help you see where each tool fits inside a modern DevSecOps pipeline.
| Attribute | Static Analysis (SAST) | Dynamic Analysis (DAST) |
|---|---|---|
| When It Runs | Early in the SDLC (e.g., in the IDE, on commit) | Later in the SDLC (e.g., QA, staging environments) |
| Code State | Analyzes static source code, binaries, or bytecode | Tests a fully compiled and running application |
| Approach | White-box (examines internal structure) | Black-box (tests from an external perspective) |
| Typical Issues Found | Coding standard violations, SQL injection patterns, buffer overflows, insecure dependencies | Cross-site scripting (XSS), authentication flaws, server misconfigurations, runtime logic errors |
| Primary Goal | Secure the code before it runs | Secure the application while it runs |
| Speed | Very fast; provides immediate feedback | Slower; requires a complete test run |
Ultimately, it’s not a choice of one or the other. A mature security posture uses SAST to keep bugs from ever getting into the main branch and DAST to ensure the deployed application can withstand real-world attacks.
Core Techniques of Dynamic Analysis
To really get what a dynamic code analyzer does, you have to look under the hood. These tools aren't just running your app and crossing their fingers. They use a handful of powerful, specialized techniques to systematically dig up hidden problems. Think of them as different investigative methods, each one built to find a specific kind of flaw.
Once you understand these core techniques, you'll have a much better grip on how dynamic analysis finds issues that static scans completely miss. Seeing how they work will help you make sense of the results and, ultimately, build more resilient software.
Instrumentation: Monitoring Code in Motion
One of the most fundamental techniques is instrumentation. Imagine you’re a detective trying to figure out a suspect's movements. You might plant tiny, invisible microphones in key spots to listen in on their conversations and track where they go. That's exactly what instrumentation does for your code.
A dynamic code analyzer injects small snippets of monitoring code—our "microphones"—into your application's binary while it runs. This extra code doesn't change what the application does, but it reports back on what’s happening on the inside.
This lets the analyzer observe critical runtime events like:
- Function Calls: Which functions are being called, in what order, and with what arguments?
- Memory Allocation: How is your application requesting and releasing memory? This is key for spotting potential leaks.
- Variable States: How do the values of variables change during execution? This can help pinpoint unexpected behavior.
Instrumentation is really the foundation for many other types of dynamic analysis, giving them the raw data needed to find performance bottlenecks and resource management headaches.
Fuzzing: Stress-Testing with Chaos
Next up is fuzzing, a technique that basically throws chaos at your code to find its breaking points. Think of a locksmith testing a new, high-security lock. They don't just try a few standard keys; they bombard it with thousands of weirdly shaped, malformed, and completely random keys to see if one of them can unexpectedly pop it open.
Fuzzing does the same thing to your application's inputs. A dynamic analyzer will automatically generate and feed your app a massive stream of invalid, unexpected, or random data. This could be anything from oversized image files to bizarre character strings in a login form.
The goal here is simple: provoke a crash, an unhandled exception, or a security loophole. Fuzzing is incredibly good at finding vulnerabilities like buffer overflows or denial-of-service weaknesses that only show up when the software is pushed way past its normal limits.
Taint Tracking: Following the Data Trail
Another sophisticated technique is taint tracking. Picture a security guard at a high-security facility trying to make sure a sensitive document never leaves the building. They might spray it with an invisible, traceable dye. Now, they can use a special light to see if that dye ends up on an unauthorized person's hands or in their briefcase.
Taint tracking works on the same principle. The analyzer "taints," or marks, any data that comes from an untrusted external source, like a user input field or an API response. It then meticulously follows this tainted data as it moves through your application.
If this "dyed" data ever ends up in a sensitive location—what’s known as a "sink"—without being properly sanitized, the analyzer raises an alarm. A common example is tainted user input being used directly in a database query, which is a classic recipe for an SQL injection attack. Taint tracking makes these dangerous data flows visible.
This method gives you concrete proof of how untrusted input can lead to serious security breaches, turning abstract threats into identifiable code paths that need to be fixed. For a deeper dive, our guide on using an AI code debugger explores how to trace and resolve these complex data-dependent bugs.
Profiling: Pinpointing Performance Drags
Finally, there's profiling, which acts like a performance coach for your application. Imagine a coach with a stopwatch timing every single movement an athlete makes during a race—the start, the stride, the finish. By analyzing these timings, the coach can identify precisely where the athlete is losing precious milliseconds and suggest improvements.
A profiler does this for your code, measuring key performance metrics as your application runs:
- CPU Usage: Which functions are hogging all the processing power?
- Execution Time: How long does each method or code block actually take to run?
- Memory Consumption: How much memory is each part of your application using at any given time?
By collecting all this data, a profiler creates a detailed performance map of your application, highlighting the exact lines of code that are causing slowdowns. This is indispensable for optimizing user experience and keeping infrastructure costs in check.
The integration of these techniques into AI-driven development is transforming software reliability. With the global dynamic code analysis market valued at USD 2.5 billion in 2023 and projected to hit USD 5.8 billion by 2032, this growth is powered by tools providing real-time feedback. AI-driven dynamic testing has already seen 39% adoption, catching 31% more issues through automated remediation. Discover more insights about this market trend on dataintelo.com to see how these methods are shaping the future of development.
Integrating Dynamic Analysis into Your Workflow
Knowing what a dynamic code analyzer does is half the battle. The other half is figuring out exactly where to slot it into your development lifecycle so it actually helps instead of just adding another step.
To get any real value out of dynamic analysis, it can't be some manual chore you run once a month. It needs to be a completely seamless, automated part of your daily work. That means pushing the analysis as close to the developer as possible and setting it up as an automated gatekeeper at key checkpoints.
The whole point is to create a super-tight feedback loop. When a developer—or, increasingly, an AI coding assistant—writes a new chunk of code, they need to know immediately if it works as expected under real-world conditions. Waiting until it hits the QA stage is just too slow. It kills momentum and creates a massive bottleneck.
Shifting Left into the IDE
The single most impactful place to put a dynamic analyzer is right inside the Integrated Development Environment (IDE). Modern IDEs like VS Code are way more than just fancy text editors; they’re the central hub for all development activity.
By plugging dynamic analysis tools directly into the IDE, developers get instant feedback as they're typing. They can validate a function's behavior without ever leaving their editor, which completely breaks the old, slow cycle of commit, wait for the build, and then review.
This is absolutely critical for teams leaning on AI to generate code. An AI assistant might spit out code that looks perfect and has no syntax errors, but it could be hiding subtle logic flaws or performance regressions. An in-IDE dynamic check can execute that new function in a sandbox on the spot, giving the developer instant confirmation that the AI’s output actually matches their intent.
Automating Quality Gates in CI/CD
While the IDE provides that instant, line-by-line feedback, your Continuous Integration/Continuous Deployment (CI/CD) pipeline is the ultimate automated quality gate. This is where dynamic analysis acts as a non-negotiable checkpoint, making sure no flawed code ever escapes into production.
Once a developer pushes their code, the CI pipeline automatically kicks off a build and deploys the application to a dedicated testing or staging environment. This is where the dynamic code analyzer jumps into action. It systematically pounds on the application, running a whole battery of checks to hunt down runtime vulnerabilities and performance killers.
Here’s what that looks like in practice:
- Code Commit: A developer pushes a new feature or a quick bug fix.
- Automated Build: The CI server grabs the latest code and compiles a runnable version of the app.
- Deploy to Staging: The application gets automatically pushed to a controlled environment that mirrors production.
- Dynamic Scan: The dynamic analyzer runs against the live app, launching fuzzing attacks, profiling performance, and running other runtime tests.
- Report and Gate: If the scan turns up anything critical, the pipeline fails. The build is blocked, and an automated report with all the dirty details gets sent straight back to the developer.
This completely eliminates the painful back-and-forth of endless pull request reviews. Instead of a teammate finding a bug days later, the pipeline catches it in minutes.
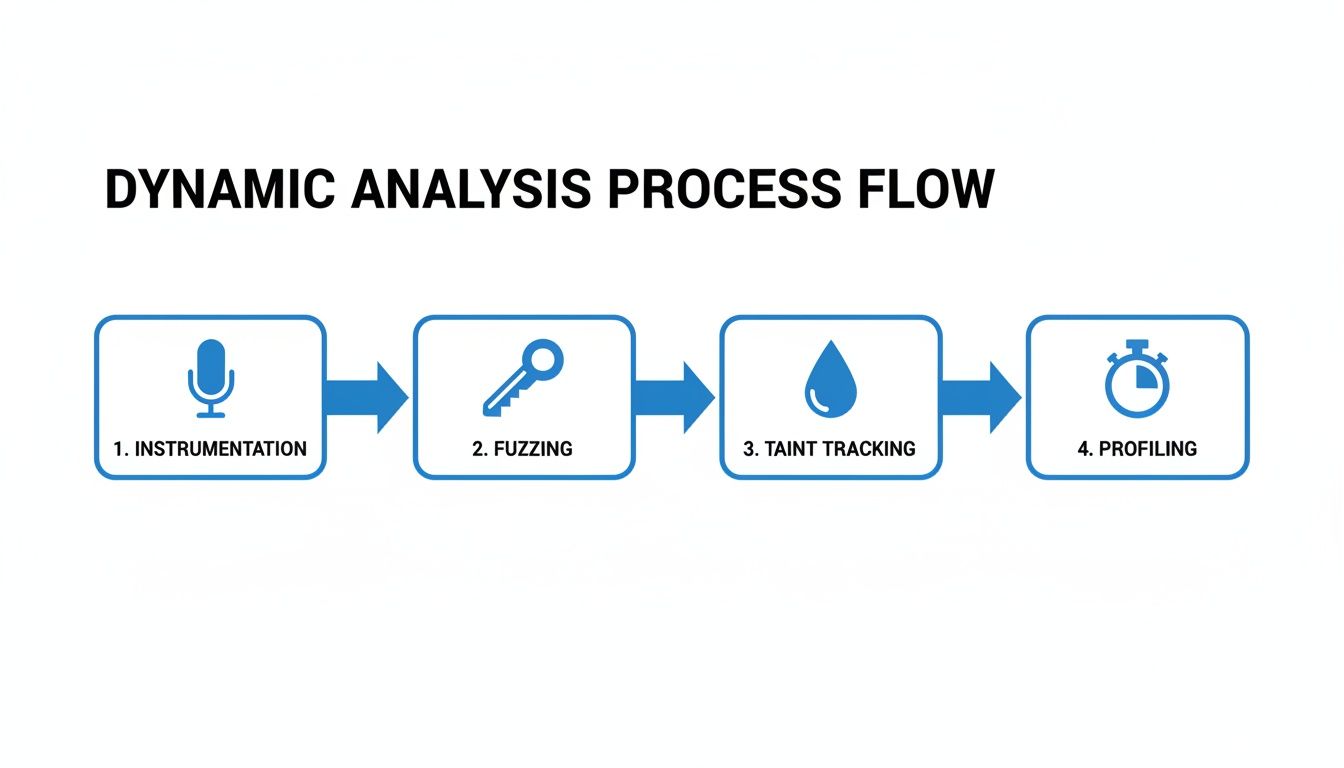
This process flow shows the core techniques a dynamic analyzer uses inside an automated pipeline, from instrumentation all the way to profiling. By automating these checks, teams can be confident that every single code change has been validated against real-world conditions before it goes live.
Think of dynamic analysis as the groundwork you do before calling in the experts. The findings from your internal scans directly inform and prepare your application for external security assessments, like those from professional penetration testing services. It bridges the gap between your automated daily checks and a deep-dive security audit, leading to a much stronger defense.
How to Choose the Right Dynamic Code Analyzer
Picking a dynamic code analyzer isn’t just about ticking boxes on a feature list. It's about finding a tool that slots so perfectly into your workflow that it feels like an extension of your team. With options ranging from scrappy open-source projects to polished enterprise platforms, it's easy to get overwhelmed. The key is to cut through the noise and focus on what actually matters for your team.
The first step is a reality check. Before you get dazzled by fancy dashboards, you need to map out your tech stack. A dynamic analyzer that doesn’t speak your language is just expensive shelfware.
Evaluate Core Compatibility and Integration
This is the absolute baseline. Does the tool support your specific programming languages, frameworks, and infrastructure? A top-tier Java analyzer is useless if your team is shipping Python on Django.
But basic language support is just the start. The real goal is seamless integration. You want dynamic analysis to be an invisible, automated safety net, not another manual chore your developers have to remember.
Your checklist should put these at the very top:
- IDE Integration: Does it plug into VS Code, JetBrains, or whatever editor your team lives in? Real-time feedback is non-negotiable for validating AI-generated code as it’s written.
- CI/CD Pipeline Compatibility: How easily does it connect to Jenkins, GitLab CI, or GitHub Actions? The tool has to work as an automated quality gate, no complicated scripting required.
- Reporting and Alerting: Where do the findings go? Look for clean, actionable reports that integrate with Slack or Jira to get issues in front of the right people instantly.
Assess the Quality of Analysis and Reporting
Not all dynamic analysis tools are created equal. The true value of a dynamic code analyzer comes from the quality of the issues it finds. A tool that drowns you in low-impact alerts or false positives will get ignored faster than a security awareness email.
A great dynamic analyzer doesn't just find problems—it provides context. It should clearly explain the vulnerability, show the exact path the problematic data took, and offer concrete suggestions for a fix. This transforms a simple alert into a valuable learning opportunity for your developers.
As you compare options, dig into the analysis depth. Does it just scratch the surface, or can it use advanced techniques like taint tracking to uncover complex data flow vulnerabilities? This is especially critical for security-conscious teams. The final piece is reporting. You need dashboards that give managers a high-level overview while providing engineers the granular, code-level details they need to fix things.
Consider Open Source vs Commercial Platforms
The "open source vs. commercial" debate is really about trading control and cost for convenience. Powerful open-source tools like OWASP ZAP offer incredible flexibility at zero cost, making them a fantastic choice for teams with the in-house expertise to configure and maintain them.
But that flexibility comes with responsibility. You’re the one on the hook for setup, tuning, and keeping it updated.
Commercial platforms, on the other hand, are built to just work. They come with polished UIs, dedicated customer support, and out-of-the-box integrations. For many engineering managers, a commercial tool actually has a lower total cost of ownership once you factor in the engineering hours saved on maintenance. They also tend to have more robust compliance and enterprise-level reporting features, which can be a deal-breaker in regulated industries.
Popular Dynamic Code Analysis Tools at a Glance
To help you get a feel for the market, here’s a quick rundown of some popular tools. This isn’t an exhaustive list, but it highlights how different solutions cater to different needs, from security-focused DAST to broader performance monitoring.
| Tool | Primary Focus | Ideal Use Case | Integration Strength |
|---|---|---|---|
| OWASP ZAP | Web App Security (DAST) | Security teams and developers needing a powerful, free tool for penetration testing. | Strong in CI/CD pipelines (Jenkins, GitLab CI); requires more setup than commercial tools. |
| Veracode Dynamic Analysis | Enterprise Security & Compliance | Organizations in regulated industries needing comprehensive security testing and reporting. | Excellent for enterprise CI/CD and issue tracking tools (Jira, Azure DevOps). |
| Datadog APM | Performance Monitoring & Profiling | Teams focused on identifying and fixing performance bottlenecks in production applications. | Deep integration with the entire Datadog ecosystem and cloud platforms (AWS, Azure, GCP). |
| Sentry | Error Tracking & Performance | Development teams needing real-time visibility into runtime errors and performance issues. | Strong IDE and source control integration (GitHub, GitLab) for code-level context. |
Ultimately, the right tool depends on whether your main goal is locking down security vulnerabilities, squashing performance bugs, or simply getting a better handle on what your application is doing at runtime.
Factor in Support for AI-Generated Code
Finally, we live in an era where AI assistants write a significant chunk of our code. Your dynamic analyzer has to keep up. The sheer speed of AI code generation means traditional, late-stage scans create a massive bottleneck. Developers are left waiting for feedback on code they didn’t even write.
This is a problem the market is racing to solve. In 2025, dynamic analysis helped catch 85% of runtime vulnerabilities that static scans missed, a crucial capability as AI code generation soared by 300%. For startups, this translates to 50% faster merges because reviews are sharpened by the feedback loop from runtime fixes. You can dive into the full research on these dynamic analysis trends to see the impact.
When you’re evaluating a dynamic code analyzer, ask how it handles the unique challenges of AI-generated code. Does it offer real-time, in-IDE scanning? Can it validate AI suggestions against your company’s specific business logic? The right tool will act as an essential guardrail, ensuring the velocity you gain from AI doesn’t come at the expense of quality and security.
Your Questions About Dynamic Analysis, Answered
Even when the concept makes sense, practical questions always come up when teams think about actually using a new tool. Let's dig into the common sticking points and clear up any confusion about bringing dynamic analysis into your workflow.
Will a Dynamic Code Analyzer Wreck Our CI/CD Pipeline Speed?
Let's be upfront: yes, dynamic analysis can add some time to your pipeline. It has to. Unlike static analysis that just reads code, a dynamic analyzer needs to interact with a live, running version of your application. That's always going to take longer than a simple file scan.
But this is a classic "pay me now or pay me a lot more later" situation. The few extra minutes a dynamic scan adds are an investment against hours—or even days—of emergency hotfixes and frantic security patching down the line.
Modern tools are also much faster than their predecessors, and you can be smart about it. Instead of running a full-blown scan on every single commit, you can configure your pipeline to run targeted scans only on the parts of the app that actually changed. Catching a critical bug in the pipeline is always cheaper and less stressful than hearing about it from a customer.
Does Dynamic Analysis Even Work for Our Programming Languages?
This is the first question you should ask, and it's a big one. For the most common languages out there—think Java, Python, .NET, JavaScript, and Go—you're in good shape. Most major commercial and open-source tools have mature, robust support for these stacks.
Where it gets tricky is with newer or more niche languages like Rust, Swift, or Kotlin. Building a reliable dynamic analysis tool is a massive effort, so support for less common languages often lags behind.
Before you look at a single feature, your first move should be to create a shortlist of tools that explicitly and fully support your team's entire tech stack. Don't just assume it works; verify it in the documentation or with their sales team. Trusting "experimental" support for a mission-critical language is a recipe for disaster.
How Is DAST Different from a Pen Test?
This comes up all the time. Both Dynamic Application Security Testing (DAST) and penetration testing (pen testing) involve poking and prodding a running application to find weaknesses. While they're chasing a similar goal, their methods and purposes are completely different.
- DAST is automated and acts like a daily workout. It's a tool you integrate into your development lifecycle to automatically and continuously scan for thousands of known vulnerability patterns. It’s your consistent, broad-coverage security net.
- Penetration testing is manual and creative, like a championship match. A skilled security expert thinks like a real attacker. They go beyond the automated checklist to find complex business logic flaws or chain together several low-risk issues to create a critical one.
They aren't interchangeable; they're complementary. DAST gives you the continuous coverage to catch common problems early and often. Pen testing gives you a deep, periodic gut-check against a clever human mind.
Do We Still Need Static Analysis if We Use Dynamic Analysis?
Yes. 100%. Relying on just one leaves you with huge blind spots. Static and dynamic analysis are two sides of the same coin, designed to catch completely different types of problems.
Think of it this way:
- Static Analysis (SAST) is like the structural engineer reviewing your building's blueprints. It inspects your source code before it's even built to find design flaws—insecure coding patterns, dangerous function calls, or vulnerable third-party libraries.
- Dynamic Analysis (DAST) is the building inspector who shows up after construction is finished. It tests how the actual application behaves in a real-world environment, looking for runtime errors and security holes that only show up when someone is actively using it.
You absolutely need both. SAST secures the code as it’s being written, while DAST validates the security of the final, running product. Using them together is the foundation of a strong DevSecOps culture.
At kluster.ai, we bring the power of real-time analysis directly into your IDE, giving you instant feedback on AI-generated code. Our platform verifies code against your intent, documentation, and security policies in seconds, catching logic errors and vulnerabilities before they ever reach the pipeline. Stop chasing bugs and start shipping trusted, production-ready code. Book a demo with kluster.ai today to see how you can cut review time in half.