

Calculate Cycle Time Formula to Speed Up Your PRs
The cycle time formula is deceptively simple: it’s the total time that passes from the moment a developer starts working on something (think: first commit) to the moment it's live in production. At its core, it's the rawest measure of your team’s delivery speed.
What Is The Cycle Time Formula and Why Does It Matter?
Cycle time isn’t just another metric for a fancy dashboard. It’s a powerful diagnostic tool for any software team trying to move faster. Think of it as the complete story of a feature, from the first line of code to its final destination with a user.
It tells you how efficient your entire development process really is, not just bits and pieces of it.
Understanding this formula helps you pinpoint exactly where work grinds to a halt. Is the problem…
- Coding Time? How long does it actually take for a developer to build the feature?
- Review Time? Is the pull request (PR) just sitting there, waiting for feedback?
- Testing & Merge Time? Are automated checks and merges slowing things down?
- Deployment Time? How long does it take to get approved code out the door?
Each of these phases adds up. When your total cycle time feels high, you can dissect it to find the real culprit. This is how a team moves from a vague feeling of "things feel slow" to a concrete diagnosis like, "our average PR sits in review for 72 hours."
The Four Key Stages of Software Development Cycle Time
To really get a handle on cycle time, you have to understand its component parts. When we break the process down into these four distinct stages, it becomes much clearer where the bottlenecks are hiding.
The Four Key Stages of Software Development Cycle Time
| Stage | Starts | Ends | What It Measures |
|---|---|---|---|
| Coding Time | First commit on a feature branch | Pull request is opened for review | The developer's initial work phase and speed of implementation. |
| Review Time | Pull request is opened | Pull request is approved by reviewers | The efficiency of your team's collaboration and feedback loops. |
| Merge Time | Pull request is approved | Code is merged into the main branch | The effectiveness of your CI pipeline and automated testing suite. |
| Deploy Time | Code is merged into main | Code is live in the production environment | The speed and reliability of your deployment automation. |
This is the key. You stop looking at the process as one big black box and start seeing the individual gears.
A long review time requires a completely different solution than a slow deployment pipeline. By focusing on these distinct phases, you can move from a general sense of inefficiency to a targeted plan for improvement.
This granular view is precisely why top engineering organizations are obsessed with this metric. The goal isn't just to ship, but to do it quickly and predictably. Understanding the cycle time formula—the elapsed time from work start to completion—is the first step.
The data from DORA shows that elite teams deploy multiple times a day with lead times under an hour, while low-performing teams can take weeks for the same process. It's a massive difference, and it all starts with measurement. You can find a deeper analysis of how cycle time measurement leads to improvement here.
By mastering this formula, you stop guessing. You start making data-driven decisions that cut out the friction, speed up delivery, and give your team back its most valuable resource: time.
How To Actually Calculate Your Cycle Time
Alright, let's get down to brass tacks. Theory is great, but to actually calculate your cycle time, you need to dig into the data already sitting in your version control system, like Git. The whole thing boils down to finding two key timestamps for every single pull request (PR) or feature branch you ship.
The formula itself is deceptively simple:
Cycle Time = (Production Deployment Timestamp) - (First Commit Timestamp)
This one calculation tells you the entire story—from the moment a developer first saved their work to the second that code went live for customers. It's the truest measure of your team's end-to-end delivery speed.
Finding Your Start and End Points
First things first, you need to define your goalposts. Being consistent here is everything.
- Start Time: This is the timestamp of the very first commit on a feature branch. This marks the true "work started" moment, often long before a PR is even a glimmer in a developer's eye.
- End Time: This is the timestamp of the final merge into your main branch that kicks off a production deployment. This is "work delivered."
A common mistake I see teams make is using the PR creation date as the start time. Don't do it. That approach completely ignores all the upfront coding work and will give you a misleadingly short cycle time. Capturing the first commit gives you a far more honest picture of the total effort.
This little flowchart breaks down the simple, three-part journey from that first line of code to the final deployment.
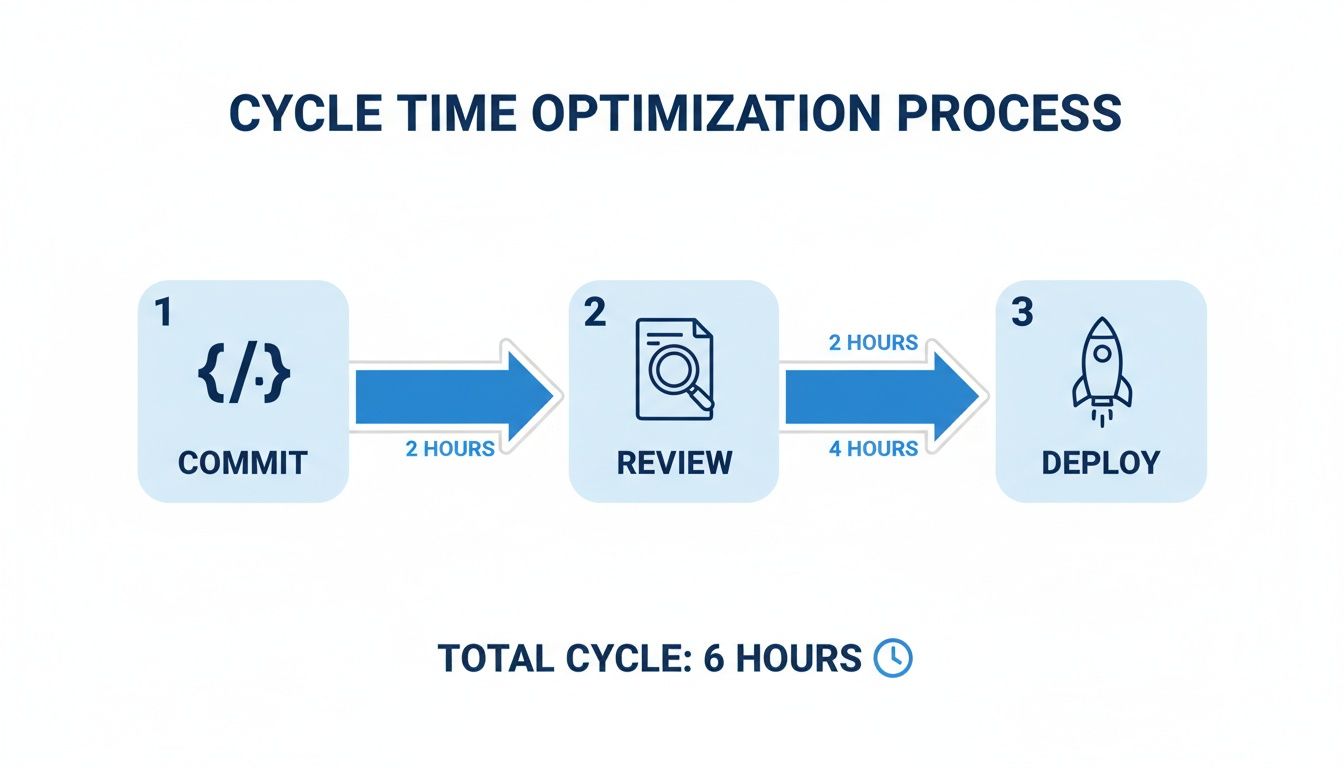
As you can see, each phase—coding, review, and deployment—is a distinct chunk of time that adds up to your total cycle time.
Practical Data Extraction from Git
So, how do you actually get these timestamps? You don't need a fancy, expensive tool to get started. You can pull this data straight from your repository's history with some basic Git commands or a simple script.
For any given branch, you can find the first commit's timestamp. Then, you just need to pinpoint the merge commit timestamp when that branch was folded into your main production line. For teams that want to get serious about this, connecting your project management and version control systems is a game-changer. We've got a guide on how to link Jira to GitHub that can help you start automating this tracking.
The goal here is to build a repeatable process. You're turning your repository's raw history into a clear, actionable dashboard of your team's performance by logging these two timestamps for every single feature you ship.
This data is pure gold. Slashing your cycle time in half can reclaim thousands of developer hours over a year. Data from CircleCI shows that while the median workflow duration is a zippy 2 minutes and 43 seconds, the 95th percentile balloons to over 25 minutes. That massive gap highlights a huge opportunity for improvement. You can read the full State of Software Delivery report for more on that.
Once you start consistently applying this formula, patterns will emerge from the noise. You'll quickly spot which kinds of tasks drag on and where your biggest delays are hiding, giving you the power to make smart, targeted improvements.
Seeing The Cycle Time Formula In Action
Theory only gets you so far. To really wrap your head around how the cycle time formula plays out in a real engineering environment, let's walk through two scenarios I'm sure you've lived through. We’ll compare a smooth, straightforward pull request against a complex, frustrating one to see exactly how different variables blow up the final number.
This side-by-side look will shine a light on where all those hidden delays are creeping into your team's workflow.
The Ideal State: A Simple Feature PR
First, the dream scenario. Imagine a developer, Alex, gets a ticket to add a simple tooltip to a UI element. It's a tiny, well-defined change with almost zero risk.
Here’s how it unfolds:
- First Commit: Alex kicks things off with a first commit on Monday at 9:00 AM. This is our start time.
- PR Opened: The coding is a breeze. Alex opens a pull request for review at 11:00 AM the same morning.
- Review & Approval: A teammate spots the PR, gives it a quick look, requests one minor text tweak, and approves it by 1:00 PM.
- Deployment: The automated CI/CD pipeline runs without a hitch. The code is merged and live in production by 1:30 PM on Monday. That's our end time.
The total elapsed time from that first commit to deployment is a mere 4.5 hours. This is the gold standard—a low-friction workflow where every single stage moves along quickly and predictably.
This kind of rapid cycle is a huge signal of a healthy process. Small PRs, fast reviews, and a solid deployment pipeline are the key ingredients for an elite-performing team.
The Realistic Struggle: A Complex Bug Fix PR
Now for something a bit more... familiar. A critical, hard-to-reproduce bug pops up, and another developer, Ben, is tasked with squashing it.
Ben dives into some nasty legacy code to track down the root cause. This isn't a simple fix; it's an investigation filled with trial and error, which makes for a much longer, more complicated process.
- First Commit: Ben’s first attempt at a fix is committed on Tuesday at 2:00 PM.
- PR Opened: After a lot more commits and head-scratching, a PR is finally ready for review on Wednesday at 4:00 PM.
- Review Loops: The reviewer finds edge cases Ben missed. This kicks off a long back-and-forth discussion with multiple new commits stretching over the next day.
- CI/CD Failure: The PR finally gets approved on Thursday at 5:00 PM, but the deployment pipeline immediately fails because of an unexpected integration test error. Ouch.
- Deployment: After another round of fixes for the pipeline, the code is finally merged and deployed on Friday at 11:00 AM.
The cycle time for this single bug fix? A painful 69 hours.
Cycle Time Calculation Comparison: Simple vs. Complex PRs
When you put these two examples next to each other, the differences become painfully obvious. A simple table makes it crystal clear where all that time vanished.
| Metric/Stage | Example 1: Simple Feature PR | Example 2: Complex Bug Fix PR |
|---|---|---|
| Start Time (First Commit) | Monday, 9:00 AM | Tuesday, 2:00 PM |
| End Time (Deployment) | Monday, 1:30 PM | Friday, 11:00 AM |
| Total Cycle Time | 4.5 hours | 69 hours |
| Major Delays | None | Lengthy review, CI/CD failure |
This comparison really highlights how factors beyond just coding—like review bottlenecks and a fragile pipeline—are often the biggest culprits behind long cycle times. By applying the cycle time formula to your own team's PRs, you can start spotting these exact patterns and figure out where your biggest opportunities for improvement are hiding.
How AI Is Rewriting The Cycle Time Formula
The old way of calculating cycle time is getting a massive overhaul, and AI is holding the pen. For engineering teams, this isn't some minor adjustment—it's a complete rethink of how fast code gets from an idea into production. And it’s all happening by attacking the single biggest bottleneck: the code review phase.
Modern AI tools are creating a new reality where that "Review Time" component of the formula shrinks from days down to just a few minutes.
AI-powered assistants are now giving developers instant, context-aware feedback right inside their IDE, long before a pull request ever sees the light of day. We're not talking about basic linting or style checks here. This is a whole different ballgame.
Proactive Quality and Context-Aware Feedback
The real game-changer is how AI can now verify that new code actually aligns with the developer's original intent. It can look at the prompt used to generate the code, compare it to the output, and immediately flag subtle logic flaws, performance hogs, or security gaps.
This proactive quality check completely eliminates the soul-crushing "PR ping-pong" that inflates cycle times. Instead of a teammate catching a mistake hours—or even days—later, the AI assistant spots it in seconds. The developer can fix it on the spot while the context is still fresh in their mind.
What this means is that the code finally submitted for human review is already polished and of a much higher quality, which drastically cuts down the time and effort needed from the rest of the team.
By catching regressions, hallucinations, and logic errors before code ever leaves the editor, AI assistants eliminate entire categories of rework. This allows teams to merge pull requests minutes after they are written, not days.
The Impact on Engineering Velocity
The data backing this shift is pretty compelling. As teams bring AI code review agents into their workflow, the impact on cycle time is immediate and significant.
Recent industry metrics show AI tool adoption has exploded from 14.8% to 51.4%. The teams that have fully embraced these tools are seeing a massive 113% increase in pull requests merged per engineer.
Even more importantly, they're slashing their median cycle time by 24%, dropping it from 16.7 hours down to just 12.7 hours. This change isn't just about speed, either—it’s also leading to better quality. Bug fix PRs have climbed from 7.5% to 9.5% of all pull requests, showing a more proactive approach to quality. You can dig into more of this data on how AI is transforming engineering metrics on Jellyfish.co.
Ultimately, AI isn't just a tool to help you write code faster. It's a mechanism for building a more efficient, high-quality development lifecycle from the ground up. By automating the most tedious and time-sucking parts of the review process, AI is fundamentally rewriting the cycle time formula for modern software teams, helping them ship better code, faster.
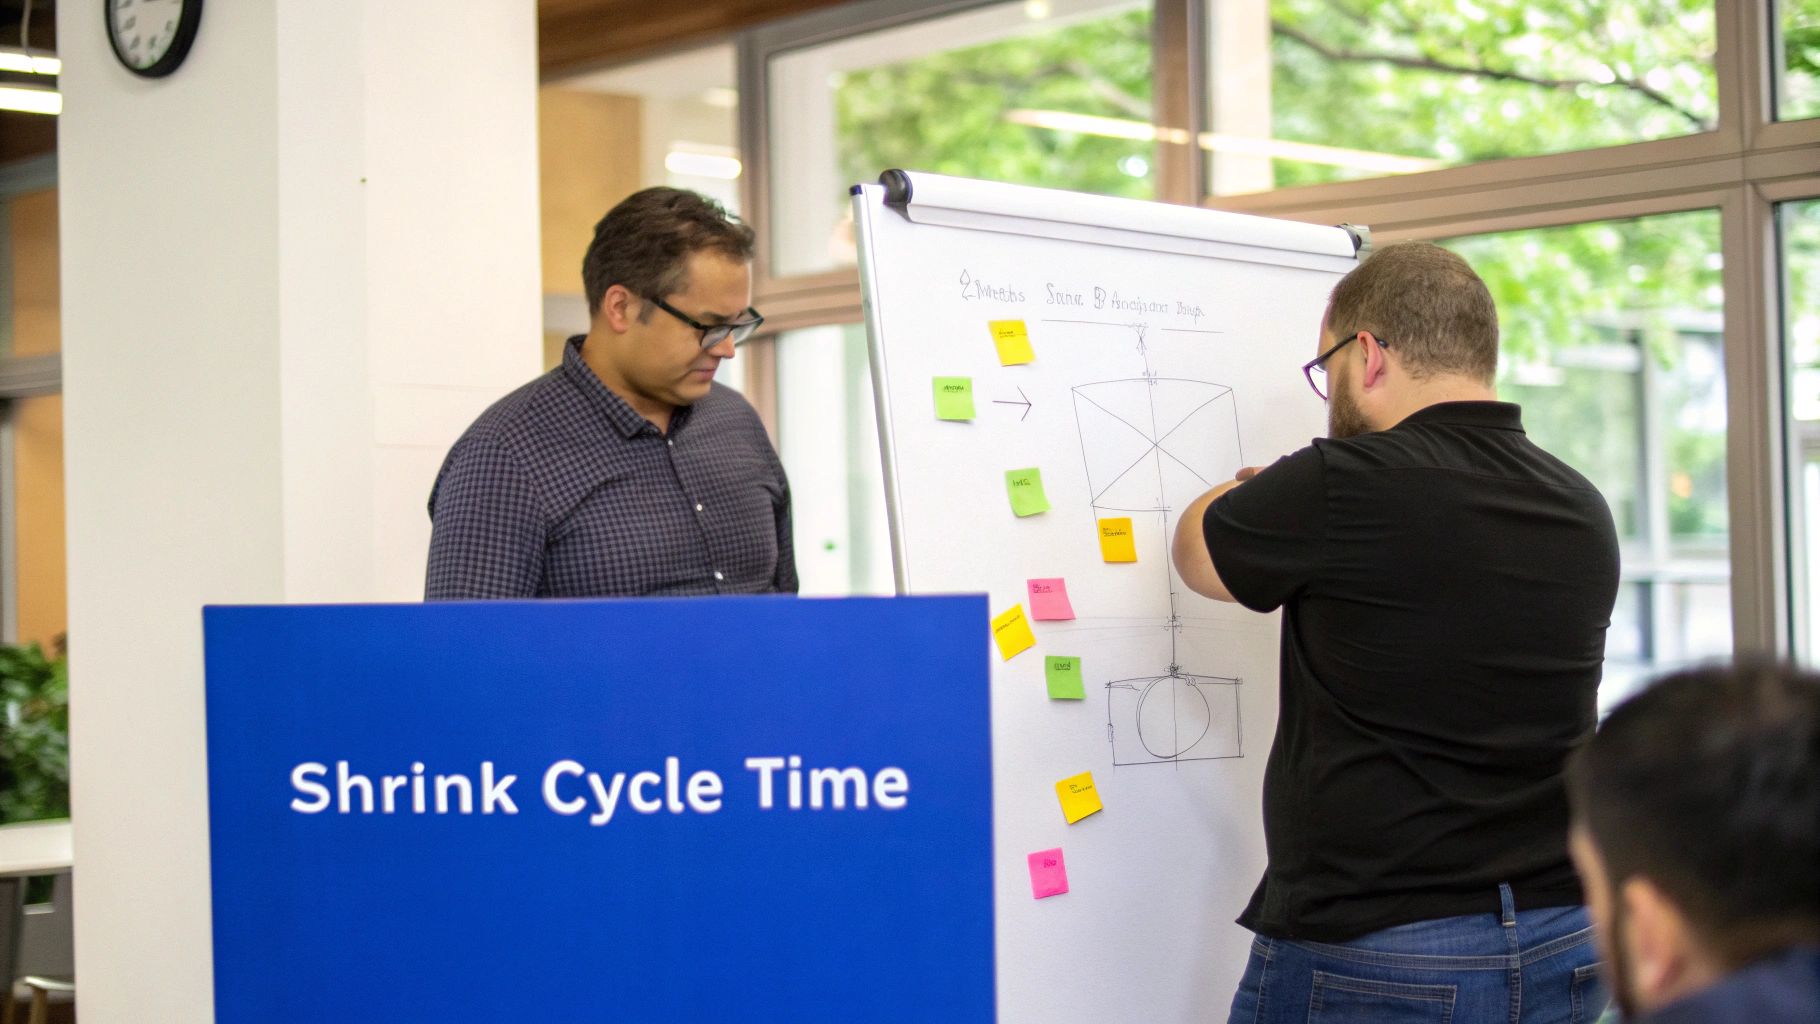
Actionable Strategies To Shrink Your Cycle Time
Knowing your cycle time is one thing; actually shrinking it is where you unlock real value. Running the cycle time formula is just the first step. You need concrete strategies to chip away at the delays in your development process, from the first commit all the way to deployment.
This isn't about cracking the whip and making your team work faster. It's about finding and removing the friction, automating the grunt work, and building a workflow where high-quality code flows smoothly and predictably.
Let's dig into some battle-tested strategies that truly move the needle.
Optimize the Coding and Review Phases
If you're looking for the biggest lever to pull, this is it: reduce the size and scope of your pull requests (PRs). Smaller, more focused PRs are just fundamentally easier for everyone to handle.
- Small Batches, Big Impact: Get your developers into the habit of breaking down large features into smaller, independently shippable chunks. A PR changing 50 lines of code is way less intimidating to review than one touching 500 lines across ten different files.
- Faster, Higher-Quality Reviews: When a PR is small, reviewers can understand the context and approve it quickly. This dramatically cuts down on the mental load and slashes the "review time" component of your cycle time. A great way to start is by implementing a clear workflow, like the one outlined in this https://kluster.ai/blog/pull-request-checklist.
Of course, the review process itself has to be solid. You need to build a culture where giving fast, constructive feedback is a top priority—not something that gets pushed to the end of the day.
Your goal should be a quick, collaborative check, not a long, drawn-out debate. When reviews happen fast, the developer still has all the context fresh in their mind, making any requested changes happen in minutes, not hours.
Streamline Your CI/CD and Deployment Pipeline
Even with lightning-fast coding and reviews, a clunky deployment pipeline can stop you dead in your tracks. Your CI/CD pipeline should be a well-oiled machine, not a source of constant headaches.
One powerful way to shrink cycle time, especially in product development, is by bringing in AI-powered strategies. For a deeper look, check out this practical guide to reducing time to market with AI. These methods often focus on automating the most time-sucking checks and balances in your pipeline.
Here are a few key optimizations to consider:
- Parallelize Your Tests: Stop running your entire test suite sequentially. Break it up and run tests in parallel to get feedback to developers in minutes, not hours.
- Automate the Annoying Stuff: Use linters and automated tools to check for code style, formatting errors, and basic security flaws. This frees up your human reviewers to focus on what actually matters—the logic.
- Embrace Feature Flags: Feature flags are a game-changer. They let you merge code into your main branch and deploy it to production "turned off." This completely decouples deployment from release, allowing you to merge small PRs constantly without ever impacting users. The result? Your merge time plummets.
By putting these strategies into practice, you're actively attacking each part of the cycle time equation. You'll build a system where small, high-quality changes flow rapidly from commit to production, boosting your team's velocity and your ability to ship value to customers.
Got Questions About Cycle Time?
As engineering teams start digging into cycle time, the same few questions always seem to pop up. It makes sense—the definitions can feel a bit fuzzy at first. Let's clear up the most common points of confusion so you can start measuring with confidence.
Getting everyone on the same page is the first step. When the whole team speaks the same language, you can move from just looking at data to actually understanding what it means for your workflow.
Cycle Time Versus Lead Time
This is easily the biggest mix-up, and it's a critical one to get right. They sound similar, but they measure two completely different things.
- Lead Time is the whole enchilada. It starts the second a customer request or new idea gets logged and doesn't end until that feature is live and in their hands. It's the entire value stream from the customer's point of view.
- Cycle Time is a much tighter, more focused metric. It only tracks the active development phase, kicking off with the first commit and stopping at deployment. This is the true measure of your engineering team's execution speed.
Here’s a simple way to think about it: lead time is how long the customer waits, while cycle time is how long your team actively works.
What Is a Good Cycle Time?
Honestly, there's no magic number. A "good" cycle time is completely relative to your product's complexity, the size of your team, and even your company's culture. Don't get hung up on chasing some universal benchmark you read about online. The only benchmark that matters is your own.
The real win isn't hitting an arbitrary number. It's building a culture of continuous improvement. A consistently shrinking average cycle time is the clearest sign you have a healthy, high-performing engineering team.
That said, the DORA metrics report that elite teams often have cycle times under 24 hours. If your team is currently measuring in weeks, your first goal should be to get it down to days. If you're at days, aim for hours.
How to Start Tracking Without Expensive Tools
You absolutely do not need a pricey analytics platform to get going. All the raw data you need—commit timestamps and deployment logs—is already sitting in your Git repository and CI/CD tools.
A simple spreadsheet is a great way to start. For every pull request, just manually log the timestamp of the first commit and the final deployment to production. Yes, it's a bit of manual work, but it’s more than enough to start spotting the biggest bottlenecks and crazy outliers.
Once you’ve got a feel for the process, you can easily write some basic scripts using the APIs from GitHub or GitLab to pull this data automatically. For more general advice on optimizing development workflows, you might find helpful info in the frequently asked questions on other dev-focused platforms.
At kluster.ai, we eliminate the review bottleneck entirely. Our real-time AI agents review code directly in your IDE, providing instant feedback before a pull request is ever opened. This slashes cycle times by catching errors early, allowing your team to merge with confidence in minutes, not days. Book a demo today to see how you can shrink your cycle time.