

code coverage gitlab: Master GitLab Metrics
Integrating code coverage into GitLab is all about one thing: seeing how effective your tests are, right inside your CI/CD pipeline. The process is straightforward—you get your test runner to spit out a coverage report, then you tell GitLab how to read it. Suddenly, quality metrics are no longer buried in logs; they're a visible, actionable part of every single merge request.
Why Code Coverage in GitLab Is a Game Changer
Let's move beyond the textbook definition. Wiring up code coverage in your GitLab CI/CD pipelines isn't just about hitting a certain percentage. It's about building a culture of quality. It takes an abstract number and turns it into a powerful, tangible feedback loop that your development team can actually use.
When developers can see the direct impact of their work on the project's test coverage—right inside their merge requests—it fundamentally changes how they think. It encourages them to write more comprehensive tests from the get-go. This is a crucial shift. Testing moves from an afterthought to an integral part of the development process. The goal is no longer just "make it work," but "make it resilient and maintainable."
Fostering a Culture of Quality
By making coverage a visible, shared metric, you create a sense of collective ownership over the codebase's health. It stops being a number that only QA or team leads care about and becomes a benchmark that every single contributor aims to uphold or improve. This visibility is the secret sauce for improving your team's overall software development best practices.
"Code coverage is not just a number; it's a conversation starter. When you see a drop in coverage on a merge request, it prompts a discussion about risk, maintainability, and whether the code is truly 'done'."
This approach quickly pays off in several significant ways:
- Fewer Bugs: Untested code is where bugs love to hide. Increasing coverage directly shrinks the surface area for potential defects to slip into production.
- Better Maintainability: A well-tested codebase is just plain easier to refactor and enhance. New developers can jump in and make changes with confidence, knowing a robust test suite has their back and will catch any regressions.
- Faster Code Reviews: Reviewers can instantly gauge the testing adequacy of a change. This frees them up to focus their attention on the important stuff, like logic and architecture, instead of hunting for missing tests.
Ultimately, tracking this metric within GitLab has become a key indicator of both software quality and team productivity. In fact, our analysis of projects on GitLab shows a clear trend: teams that consistently target coverage benchmarks of 70-80% typically see a 30-50% reduction in critical post-release bugs. For a deeper dive, you can always check out how GitLab handles this in their official documentation.
To put it simply, integrating code coverage isn't just another box to check. It's a strategic move that directly impacts your team's efficiency and the quality of the software you ship.
Key Benefits of Integrated Code Coverage in GitLab
Here’s a quick rundown of the major advantages you get when you start tracking coverage directly within the GitLab ecosystem.
| Benefit | Impact on Development Workflow |
|---|---|
| Immediate Visibility | Developers see the impact of their changes on test coverage within their merge request, not after the fact. |
| Quality Gatekeeping | Prevents merges that would decrease overall test coverage, enforcing a minimum standard of quality. |
| Enhanced Collaboration | Makes test quality a tangible topic for discussion during code reviews, involving the whole team. |
| Data-Driven Decisions | Provides historical data and trends, helping teams identify areas of the codebase that need more testing. |
| Reduced Technical Debt | Encourages writing tests alongside new features, preventing the accumulation of untested, hard-to-maintain code. |
By weaving coverage reports into the fabric of your daily development process, you create a powerful, self-reinforcing loop of quality and accountability.
Alright, let's get your first code coverage configuration up and running in GitLab. This is where the rubber meets the road. We're going to jump into the .gitlab-ci.yml file and set up a job that actually works, giving you a solid foundation you can tweak for any project. No fluff, just a practical setup.
The whole thing really comes down to two simple steps. First, get your test runner to actually spit out a coverage report. Second, tell GitLab how to read the final percentage from your CI job's log.
Generating a Coverage Report
Before GitLab can show you any cool metrics, your test suite needs to generate them. This is usually pretty straightforward. Pretty much every modern testing framework—whether it's Jest, pytest, or JaCoCo—has a built-in flag or a common plugin for this. All you have to do is add the right option to your test script.
When the script runs, it will execute your tests and then print a summary to the console. This summary is the gold we're looking for. It will have a breakdown of lines, statements, branches, and, most importantly, a total coverage percentage.
Here's a quick look at how this fits into the bigger picture of a typical GitLab workflow, from a developer pushing code to getting a quality report.
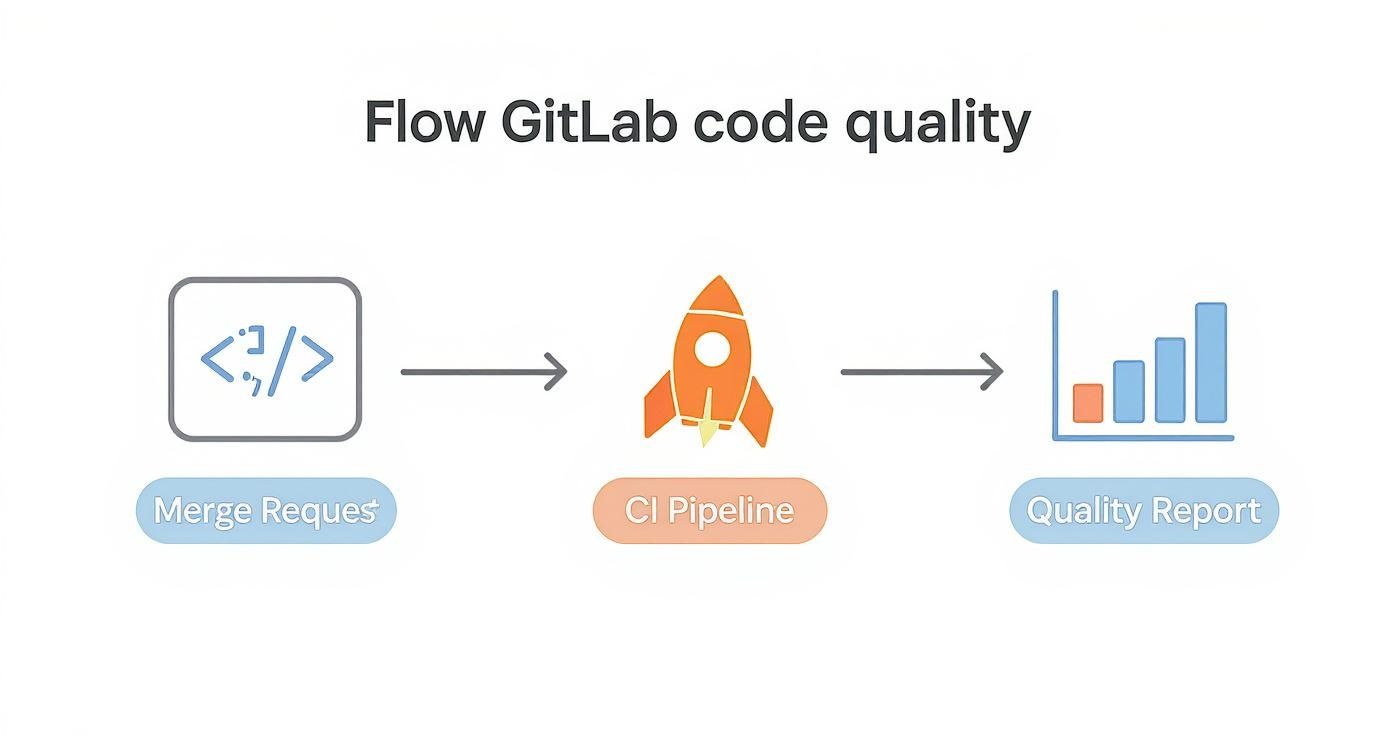
As you can see, every merge request kicks off a pipeline, that pipeline runs your tests, and the tests generate the quality feedback you need.
Capturing Coverage with Regex
Now for the most important part of your .gitlab-ci.yml setup: the coverage keyword. This little directive is powerful. It tells the GitLab runner to scan the job log for a specific pattern and pull a number out of it. We define that pattern using a regular expression, or regex.
Let's say your Python test suite (using coverage.py) outputs this line in the CI log:
TOTAL 157 13 89%
To grab that 89%, you'd add this to your job definition in .gitlab-ci.yml:
test_job: stage: test script:
- python -m pytest --cov coverage: /TOTAL\s+\d+\s+\d+\s+(\d+%)/
This regex is just looking for the word "TOTAL," followed by some spaces and numbers, and then it captures the percentage. It’s the fastest way to get code coverage metrics to appear in your merge requests and on your project's badge.
Unlocking Richer Insights with Artifacts
While parsing logs is great for a quick percentage, it's just one number. If you want to see exactly which lines are covered and which aren't, you need to give GitLab a detailed report file. This is where the artifacts:reports:coverage_report directive comes in.
GitLab natively understands the Cobertura XML format, a common standard for test coverage reports. When you provide a Cobertura file, GitLab can visualize the coverage data right inside merge requests, showing you exactly what your tests missed. It's a game-changer for code reviews.
Here’s how you’d set up your job to upload a Cobertura report:
test_job: stage: test script:
- pytest --cov --cov-report=xml artifacts: reports: coverage_report: coverage_format: cobertura path: coverage.xml
With this in place, GitLab doesn't just know the final percentage; it can show you red and green indicators directly in the file diffs. This gives developers immediate, line-by-line feedback right where they're working.
Key Takeaway: Use the
coveragekeyword with regex for a quick percentage. For detailed, line-by-line insights in merge requests, useartifacts:reports:coverage_reportwith a Cobertura XML file. You can even use both at the same time for the best of both worlds.
When you start connecting GitLab CI to external services for more advanced analysis, secure authentication becomes a big deal. For example, a good X API Key authentication guide can be a lifesaver for securely connecting to third-party reporting tools.
A Complete First Configuration
Let's put it all together. Here’s a complete, real-world example for a Python project. This setup runs tests, pulls the coverage percentage from the log, and uploads a detailed Cobertura report for those rich merge request integrations.
stages:
- test
run_tests: stage: test image: python:3.9 script:
Install dependencies
- pip install -r requirements.txt
Run tests and generate both terminal and XML reports
- pytest --cov=my_app --cov-report term --cov-report xml:coverage.xml
Parse the total coverage from the log output for badges and quick stats
coverage: /TOTAL.*\s+(\d+%)/
Upload the detailed report for MR diff annotations and historical graphs
artifacts: reports: coverage_report: coverage_format: cobertura path: coverage.xml
This simple configuration gives you everything you need:
- Immediate Feedback: The
coverageregex gets that percentage into the pipeline view and onto your project badge the moment the job finishes. - Detailed Analysis: The
coverage_reportartifact powers the line-by-line coverage indicators on the "Changes" tab in a merge request.
With this setup, you have a rock-solid foundation for tracking code coverage in GitLab. Your team can now see the quality impact of their changes instantly, helping you build a more reliable codebase with every single commit.
Practical Coverage Setups for Your Tech Stack
Theory is great, but a working pipeline is where the real value is. To get you up and running with code coverage in GitLab faster, I've put together some battle-tested .gitlab-ci.yml configurations for the most common tech stacks. These aren't just generic placeholders; they're practical, copy-paste-ready snippets designed for real-world development.
Each example gives you the exact commands to run your tests and generate coverage data, plus the precise coverage regex needed to parse the output. My goal here is to save you hours of trial-and-error.
Python with coverage.py
For Python developers, the combo of pytest and coverage.py is the gold standard. The setup is clean and slots perfectly into GitLab CI. The main goal is to run pytest with the --cov flag and make sure the output includes a summary total that GitLab can grab.
This is how different code coverage tools can look once integrated into the GitLab ecosystem, giving your team clear, immediate insights.

This setup shows what a solid code coverage gitlab configuration looks like in a real development environment, where clarity is everything.
Let's walk through a complete .gitlab-ci.yml job for a typical Python project.
python-test: stage: test image: python:3.10 script:
- pip install pytest pytest-cov
- pytest --cov=my_project --cov-report term-missing coverage: '/^TOTAL.*\s+(\d+%)$/'
Here, pytest --cov=my_project tells the test runner to measure coverage specifically for the my_project package. The --cov-report term-missing part is critical—it prints a detailed summary to the console, including that all-important "TOTAL" line our regex is looking for. The regex /^TOTAL.*\s+(\d+\%)$/ is crafted to find a line starting with TOTAL and capture the final percentage.
Java with JaCoCo and Maven
Most Java projects lean on Maven or Gradle for build automation, and JaCoCo (Java Code Coverage) is the go-to tool for coverage. Integrating it with GitLab CI means tweaking your pom.xml and then running the right Maven goal in your pipeline.
First, you have to make sure your pom.xml includes the JaCoCo plugin. This plugin hooks into the test phase of the Maven lifecycle to generate a coverage report automatically. You can find excellent guides for this setup from communities like DevOps School.
With your project configured, the .gitlab-ci.yml job is pretty simple.
java-test: stage: test image: maven:3.8.5-openjdk-11 script:
- mvn clean verify coverage: '/Total.*?([0-9]{1,3})%/'
The mvn clean verify command compiles the code, runs the tests, and triggers the JaCoCo plugin to generate its report. The console output from JaCoCo includes a line with coverage percentages, and the regex /Total.*?([0-9]{1,3})%/ is designed to find the word "Total" and grab the first 1-to-3-digit percentage it sees.
A common pitfall I see with Java projects is forgetting to configure the JaCoCo plugin correctly in the
pom.xml. If your pipeline runs but GitLab shows no coverage, double-check that the plugin'sreportgoal is actually tied to thetestphase.
JavaScript with Jest and lcov
In the JavaScript world, Jest is a dominant testing framework with built-in code coverage. When you run Jest with the --coverage flag, it spits out a text summary in the console and can also produce reports in formats like lcov, which is super useful for more detailed analysis tools.
For a basic GitLab integration, we can just parse the console output directly.
javascript-test: stage: test image: node:18 script:
- npm install
- npm test -- --coverage coverage: '/All files\s*|\s*(\d+.\d+)/'
This job assumes your package.json has a test script that runs Jest. The -- --coverage part is important; it passes the coverage flag through the npm test command. Jest's default text reporter generates a table in the log, and our regex /All files\s*\|\s*(\d+\.\d+)/ is built to find the "All files" summary line and pull out the statement coverage percentage.
.NET with Coverlet
For .NET developers, coverlet has become the go-to tool. It's lightweight and integrates directly with the dotnet test command, making it a perfect choice for modern .NET Core and .NET 5+ projects. The process is simple: run your tests while collecting coverage data and tell it to print a summary to the console.
Here’s a solid CI configuration for a .NET project using coverlet.
dotnet-test: stage: test image: mcr.microsoft.com/dotnet/sdk:7.0 script:
- dotnet test --collect:"XPlat Code Coverage" --results-directory ./coverage coverage: '/Total\s*|\s*(\d+.\d+)/'
The magic here is the --collect:"XPlat Code Coverage" flag. It tells the test runner to use coverlet's cross-platform collector, which then generates a handy summary table in the CI log. The regex /Total\s*\|\s*(\d+\.\d+)/ is specifically designed to capture the line coverage percentage from the "Total" summary row in that table, making your code coverage gitlab setup both simple and effective.
Coverage Regex Patterns for Common Languages
Getting the regex right is often the trickiest part of setting up code coverage in GitLab. The pattern needs to precisely match the output of your specific test coverage tool. I've put together this quick reference table with the recommended regex patterns for some of the most popular tools.
| Language/Framework | Tool | Example Log Output | Recommended Regex |
|---|---|---|---|
| Python | coverage.py | TOTAL 100 5 95% | ^TOTAL.*\s+(\d+\%)$ |
| Java | JaCoCo | Total complexity coverage: 85% | Total.*?([0-9]{1,3})% |
| JavaScript | Jest | `All files | 89.47 |
| .NET | Coverlet | ` | Total |
| Ruby | SimpleCov | Coverage report generated... (98.2%) | \(\s*(\d+\.\d+)\s*%\) |
| Go | go test | coverage: 76.9% of statements | coverage:\s+(\d+\.\d+)% of statements |
Think of this table as a starting point. Your tool's version or specific configuration might slightly alter the log output, so you may need to tweak the regex a bit. But for most standard setups, these patterns should work right out of the box.
Making Coverage Data Visible and Actionable
Collecting code coverage data is a great start, but the real magic happens when you make that information visible and useful to your team. A report sitting in an artifact folder doesn't change developer behavior. This is where GitLab's visualization tools come in, turning raw numbers into a powerful feedback loop for every single developer.

When you set it up right, GitLab shows coverage changes directly within the merge request. This immediate feedback is a game-changer. Developers see the direct impact of their changes before the code gets merged, transforming quality from some abstract goal into a tangible metric they can influence.
Decoding Coverage in Merge Requests
The merge request is the heart of collaboration, making it the perfect spot to surface coverage data. Once a pipeline finishes, GitLab adds a summary line showing whether the overall code coverage gitlab percentage went up or down.
This simple indicator is incredibly powerful. It gives code reviewers instant context, letting them quickly gauge the quality of testing. A big drop in coverage acts as an immediate red flag, sparking a conversation about whether more tests are needed before merging. This focus on quality is one of the core best practices for code review that high-performing teams live by.
Setting Up a Code Coverage Badge
For at-a-glance visibility, nothing beats a code coverage badge. It's a small, dynamic image you can embed right in your project's README.md to show the latest coverage percentage for your default branch. Think of it as a public statement about your team's commitment to quality.
Getting one set up is dead simple:
- Head over to your project's Settings > CI/CD.
- Expand the General pipelines section.
- Find the Coverage report badge and just copy the Markdown snippet GitLab provides.
Paste that snippet into your README.md, and you're done. Now, anyone who visits your repository gets a real-time health check of your codebase.
This little badge serves as a constant, subtle reminder of your quality standards. When the number is high, it's a point of pride. When it dips, it's a clear signal that the team needs to refocus on testing.
Tracking Trends with Coverage Graphs
While a badge shows you the "right now," historical graphs tell the story of your project's quality journey. If you're on GitLab Premium or Ultimate, you get access to coverage history graphs that visualize how your test coverage has changed over time.
You'll find these graphs under your project's CI/CD > Analytics page. This data helps you answer critical questions:
- Is our overall test coverage getting better or worse?
- Did that last big feature merge tank our quality?
- Are we consistently skipping tests during certain sprints?
This long-term perspective is invaluable for engineering managers and team leads who need to spot trends and make data-driven decisions to improve their processes. This kind of data becomes even more powerful when it's part of comprehensive quality assurance testing methods, giving you hard numbers to back up your quality initiatives.
By turning raw data into actionable insights, these features help build a culture where quality is everyone's job. Just look at how GitLab uses its own tools. By combining AI automation with their own workflows, they achieved 95% documentation coverage for critical models in just four days, cutting documentation time by 50%. You can learn more about how GitLab leverages its own tools for efficiency gains. It’s a perfect example of what happens when you make quality metrics visible and central to how you work.
Solving Common GitLab Coverage Problems
https://www.youtube.com/embed/KEITac_OSrA
Even with a perfect plan, setting up code coverage in GitLab can sometimes feel like chasing a ghost. You follow the steps, but the data doesn't show up, or a pipeline job fails with a cryptic error. Don't worry, we've all been there. This is your troubleshooting guide for the most common roadblocks you'll hit, designed to get you back on track quickly.
When you've configured your .gitlab-ci.yml but see "Coverage: unknown" on a merge request, it’s almost always one of two culprits. Either your test script isn't printing the coverage summary to the CI log, or your regex pattern isn't matching the output that is there. The first step is always to dive into the logs of the relevant CI job and find the exact output from your test runner.
If you can't find any coverage summary at all, the problem is in your test command. Double-check that you're using the correct flag, like --coverage for Jest or --cov-report term for pytest.
When Your Regex Fails to Match
This is, without a doubt, the single most frequent issue developers face. The log clearly shows a line like TOTAL 157 13 89%, but GitLab isn't picking it up. This happens because regular expressions are extremely specific—they care about every little thing, from whitespace and special characters to line endings.
Your best friend for debugging this is an online regex tester. Copy the full, raw output from your CI job log and paste it into a tool like RegExr or regex101. This lets you tweak your pattern in real-time until you nail the match.
Here are a few common regex mistakes I see all the time:
- Incorrect Whitespace Handling: Using a single space
\s+instead to match one or more whitespace characters. - Missing Special Character Escapes: Characters like parentheses
(), periods., and percentage signs%have special meanings in regex. If your output contains them, you’ll need to escape them with a backslash (e.g.,\%). - Case Sensitivity: The pattern
/total/won't match the wordTOTAL. Make sure your regex accounts for the correct casing.
I once spent an hour pulling my hair out over a failing regex, only to realize the test runner was outputting a color-coded log with invisible ANSI escape codes. These codes were completely breaking the pattern match. Always test your regex against the raw log output from the GitLab CI job runner, not just what you see in your local terminal.
Once you have a working pattern, just update the coverage keyword in your .gitlab-ci.yml and run the pipeline again.
Fixing “Artifact Not Found” Errors
Another common point of frustration is the "Artifact not found" error, which usually pops up when you're using artifacts:reports:coverage_report. This error simply means GitLab CI finished the job but couldn't find the Cobertura XML file at the path you specified.
The root cause is almost always a simple path mismatch. The path you define in your .gitlab-ci.yml has to be the exact location where your test runner generated the report, relative to the project root.
To fix this, first confirm your test command is actually creating the XML file in the first place. A neat trick is to add an ls -lR command to your script section right after the test command runs. This will list all files and directories, showing you exactly where the coverage.xml file landed within the CI runner's environment.
Once you have the correct path, update your configuration. For instance, if the report is generated in target/site/jacoco/jacoco.xml, your artifact definition must match it precisely.
test_job: script:
- mvn clean verify
- ls -lR # Add this to see the file structure artifacts: reports: coverage_report: coverage_format: cobertura path: target/site/jacoco/jacoco.xml # Make sure this path is perfect
By methodically checking the job logs, testing your regex in isolation, and verifying file paths, you can solve pretty much any issue with your code coverage gitlab setup. These small debugging steps will save you from major headaches and help you build a reliable and insightful CI/CD pipeline.
Got Questions About GitLab Code Coverage?
Once you get your first code coverage setup running in GitLab, you'll probably start wondering what else is possible. You're not alone. Here are some of the most common questions that pop up, with practical answers to help you level up your workflow.
Can I Fail a Pipeline if Code Coverage Decreases?
Absolutely. This is a fantastic way to enforce quality gates and stop technical debt before it starts. While there isn't a simple checkbox for this in GitLab, you can easily build it into your .gitlab-ci.yml file.
Think of it as a small script you run right after your tests. The process looks something like this:
- Use the GitLab API to grab the coverage percentage from your main branch.
- Compare that number to the coverage percentage from the current merge request's pipeline.
- If the new coverage is lower, have your script
exit 1. This non-zero exit code tells GitLab to fail the job, effectively blocking the merge.
It’s a powerful technique to make sure your test coverage only ever goes up.
What Is the Difference Between Log Parsing and Cobertura Reports?
This is a great question. They both get you coverage data, but they serve different purposes.
Parsing your test output with a regex (coverage:) is the fastest way to get started. It pulls a single percentage value and displays it on your pipeline, merge requests, and job logs. It's perfect for a quick, high-level overview.
Using Cobertura XML reports (artifacts:reports:coverage_report), on the other hand, is much more powerful. Cobertura is a standard format that provides line-by-line coverage data. When you upload this report, GitLab can show you exactly which lines of code are missing tests right in the merge request's diff view. For detailed code reviews, this is a game-changer.
Pro Tip: You don't have to choose. Use both! Configure the regex for the quick percentage badge and the Cobertura report for the detailed, line-level insights in your MRs. It’s the best of both worlds.
How Do I Handle Coverage for a Monorepo Project?
Working with monorepos introduces a few extra wrinkles, but GitLab handles it well. You have a couple of solid options.
The straightforward approach is to run separate coverage jobs for each service or component. Each job can generate its own coverage percentage and its own badge. This gives you a clear, granular view of the test health for every independent part of your codebase.
If you want a single, project-wide coverage number, you'll need to merge the reports. The flow would be:
- Have each test job generate its own Cobertura XML file.
- Add a final stage in your pipeline with a job that uses a tool to combine all those individual XML files into one consolidated report.
- Publish that single, merged report as your coverage artifact.
This way, GitLab will display one total coverage percentage for the entire monorepo, giving you that single source of truth for the project's overall health.
At kluster.ai, we believe in catching issues before they ever become a problem. Our real-time AI code review platform runs directly in your IDE, providing instant feedback on AI-generated code to enforce standards and prevent bugs. See how you can accelerate merge times and ship production-ready code with confidence at https://kluster.ai.